📊 Bitcoin (BTC/USD) – 15m Chart Analysis
🔹 1. Trend & Price Action
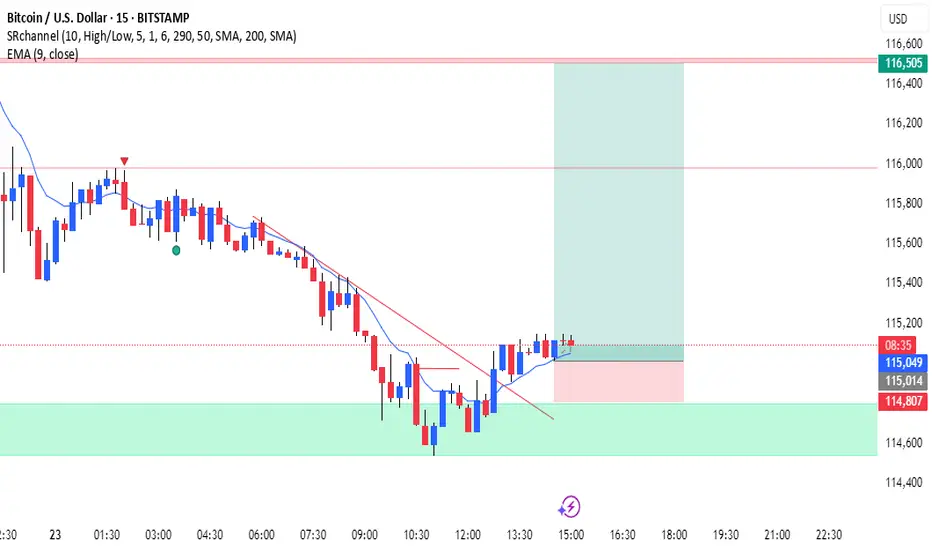
Previous downtrend with lower highs and lower lows.
Price found support around 114,600–114,800 (green demand zone).
Bullish breakout above descending trendline → early sign of reversal.
Formation of higher lows after bounce → shift in momentum.
🔹 2. EMA (9) Signal
Price is currently above EMA 9.
EMA is curving upward, signaling short-term bullish momentum.
As long as candles stay above EMA, buyers are in control.
🔹 3. Trade Setup
✅ Bullish (Long) Signal
Entry Zone: 115,050 – 115,150
Stop-Loss: 114,800 (below support)
Take-Profit: 116,500 (previous resistance)
Risk-Reward Ratio: ~1:4
🔹 4. Risk / Invalidation
If price closes back below EMA 9 and 114,800, bullish setup is invalid.
In that case, expect continuation toward 114,400 or lower.
📌 Summary
BTC is showing a bullish reversal signal on the 15m chart.
Support held at 114,600–114,800.
Price broke the trendline and trades above EMA 9.
As long as it stays above 114,800, upside toward 116,500 is favored.
🔹 1. Trend & Price Action
Previous downtrend with lower highs and lower lows.
Price found support around 114,600–114,800 (green demand zone).
Bullish breakout above descending trendline → early sign of reversal.
Formation of higher lows after bounce → shift in momentum.
🔹 2. EMA (9) Signal
Price is currently above EMA 9.
EMA is curving upward, signaling short-term bullish momentum.
As long as candles stay above EMA, buyers are in control.
🔹 3. Trade Setup
✅ Bullish (Long) Signal
Entry Zone: 115,050 – 115,150
Stop-Loss: 114,800 (below support)
Take-Profit: 116,500 (previous resistance)
Risk-Reward Ratio: ~1:4
🔹 4. Risk / Invalidation
If price closes back below EMA 9 and 114,800, bullish setup is invalid.
In that case, expect continuation toward 114,400 or lower.
📌 Summary
BTC is showing a bullish reversal signal on the 15m chart.
Support held at 114,600–114,800.
Price broke the trendline and trades above EMA 9.
As long as it stays above 114,800, upside toward 116,500 is favored.
Dagangan aktif
Penerbitan berkaitan
Penafian
Maklumat dan penerbitan adalah tidak dimaksudkan untuk menjadi, dan tidak membentuk, nasihat untuk kewangan, pelaburan, perdagangan dan jenis-jenis lain atau cadangan yang dibekalkan atau disahkan oleh TradingView. Baca dengan lebih lanjut di Terma Penggunaan.
Penerbitan berkaitan
Penafian
Maklumat dan penerbitan adalah tidak dimaksudkan untuk menjadi, dan tidak membentuk, nasihat untuk kewangan, pelaburan, perdagangan dan jenis-jenis lain atau cadangan yang dibekalkan atau disahkan oleh TradingView. Baca dengan lebih lanjut di Terma Penggunaan.