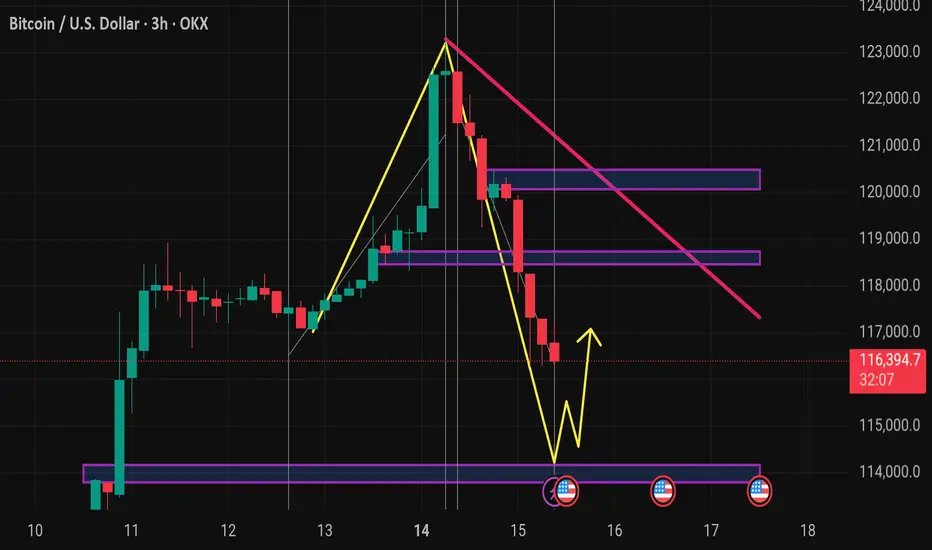
This chart displays the Bitcoin (BTC/USD) 3-hour price action with several technical indicators and patterns annotated. Here's a breakdown of what it shows:
Key Observations:
1. Price Action:
BTC is currently priced around $116,386, showing a -2.93% drop.
A strong downtrend has formed after a significant upward move, possibly forming a bearish ABCD pattern.
2. Harmonic Pattern:
The chart appears to reflect a completed harmonic retracement, with a deep retracement (near 0.88 Fibonacci level).
This suggests a potential reversal or bounce zone.
3. Support & Resistance Zones:
Several purple horizontal boxes indicate key support and resistance zones.
The current price is approaching a major support zone near $114,000–$115,000, which has been tested previously (visible on the left side).
4. Trend Lines:
A pink downward trend line suggests ongoing bearish momentum.
Price may need to break above this line to confirm a reversal.
5. Yellow Zig-Zag Path:
Indicates a possible bullish reversal scenario, predicting a bounce off the lower support zone followed by a move upward.
6. Event Markers:
Red circular icons (with flags) near the support zone hint at upcoming fundamental news/events that may influence price action.
---
Interpretation:
Short-term bias: Bearish until strong support holds (~$114,000–$115,000).
Possible trade setup: Watch for bullish reversal signals at support (candlestick patterns, RSI divergence, etc.) before entering long.
**Risk
🎯XAUUSD GOLD Daily 8-9 Free Signals🚀 World Best community Join Here ✅
💫XAUUSD
💫BTC
💫EURUSD
For Signals Telegram channel
⬇️⬇️⬇️⬇️⬇️⬇️⬇️⬇️⬇️⬇️⬇️⬇️⬇️
t.me/technicaltrader10
💫XAUUSD
💫BTC
💫EURUSD
For Signals Telegram channel
⬇️⬇️⬇️⬇️⬇️⬇️⬇️⬇️⬇️⬇️⬇️⬇️⬇️
t.me/technicaltrader10
Penafian
Maklumat dan penerbitan adalah tidak dimaksudkan untuk menjadi, dan tidak membentuk, nasihat untuk kewangan, pelaburan, perdagangan dan jenis-jenis lain atau cadangan yang dibekalkan atau disahkan oleh TradingView. Baca dengan lebih lanjut di Terma Penggunaan.