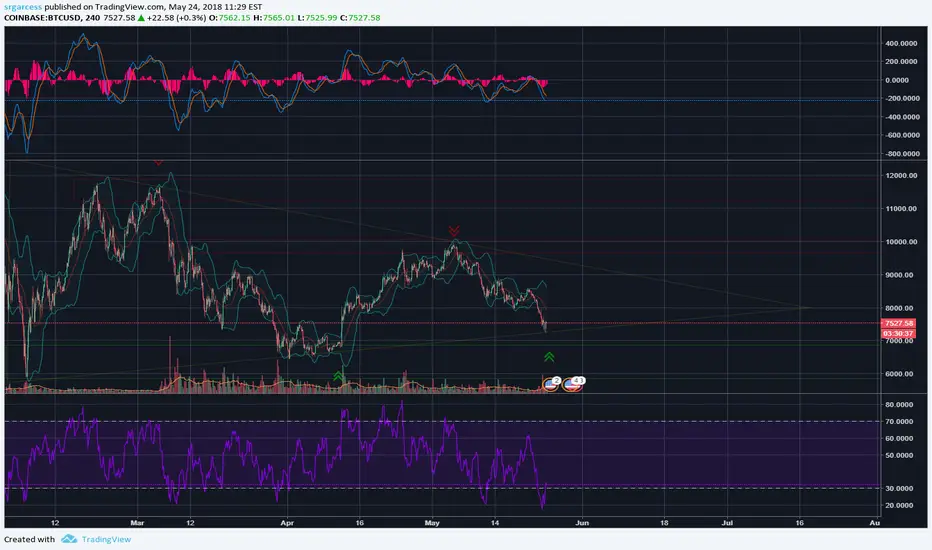
Welcome guys, on the 4h chart we can notice that a symmetrical triangle pattern is developing. Let's recall that this chart formation happens when the slope of the price's high and the slope of the price's low converge together to a point it creates the triangle. So how do we want to trade this? We cannot trade this, until we see a tighter squeeze in the price mostly closer to 8k.
If you are waiting in the side lines your approach will be as following: (lower Risk only)
We are approaching a greater support zone at the 78.6% level (Prices 6.9k - 7.1K) and it is our last chance to place low risk long calls on BTCUSD. Do not trade the consolidation of this triangle until the break.
If you bought in already: (higher risk only)
Trading within consolidations is not recommended but if you're already in a you trade many times a day. We have a plan for you.
 BTCU long calls placed at $7,530. Target BTCU $8,000 (take partial or total profit at this dynamic resistance), if you took partial profit at the previous target, the next target will be the top of the triangle at BTCU $9,000
Conclusion
Overall, on daily charts the buyers are not in control, the bears are. There's disagreement between the prices and that's why we are seeing consolidation near a major support zone. Any signal that confirms overwhelming sell-off will make us reconsider our long calls.
Happy trading, until next time,
SrG.
If you are waiting in the side lines your approach will be as following: (lower Risk only)
We are approaching a greater support zone at the 78.6% level (Prices 6.9k - 7.1K) and it is our last chance to place low risk long calls on
If you bought in already: (higher risk only)
Trading within consolidations is not recommended but if you're already in a you trade many times a day. We have a plan for you.
Conclusion
Overall, on daily charts the buyers are not in control, the bears are. There's disagreement between the prices and that's why we are seeing consolidation near a major support zone. Any signal that confirms overwhelming sell-off will make us reconsider our long calls.
Happy trading, until next time,
SrG.
Nota
Welcome guys, here is my update on the previous chart. Let's get to it and observe the triangle pattern from the daily chart now. As we could see, prices are bouncing off the triangle support line as expected. A tiny sell-off happened but bulls quickly gained momentum to hold the prices. If the According to our indicators:
RSI confirmed price reversal at $7,087
MACD lines are negative flat which show neutral momentum. No Signal
EMA, strong bullish candles have been formed above the 10EMA, premature bullish signal. (Leading indicator)
MA, only one bullish candle have been formed above the 50MA, bullish signal
That's all I can see for now, stay tuned for updates. Any ideas of possible market movements are welcome.
Happy Trading,
SRGARCESS
Penafian
Maklumat dan penerbitan adalah tidak dimaksudkan untuk menjadi, dan tidak membentuk, nasihat untuk kewangan, pelaburan, perdagangan dan jenis-jenis lain atau cadangan yang dibekalkan atau disahkan oleh TradingView. Baca dengan lebih lanjut di Terma Penggunaan.
Penafian
Maklumat dan penerbitan adalah tidak dimaksudkan untuk menjadi, dan tidak membentuk, nasihat untuk kewangan, pelaburan, perdagangan dan jenis-jenis lain atau cadangan yang dibekalkan atau disahkan oleh TradingView. Baca dengan lebih lanjut di Terma Penggunaan.