and look where it is now; right where it has to be !!
last year it looked as if all the fud bulls were right and I was wrong, but by now we know better
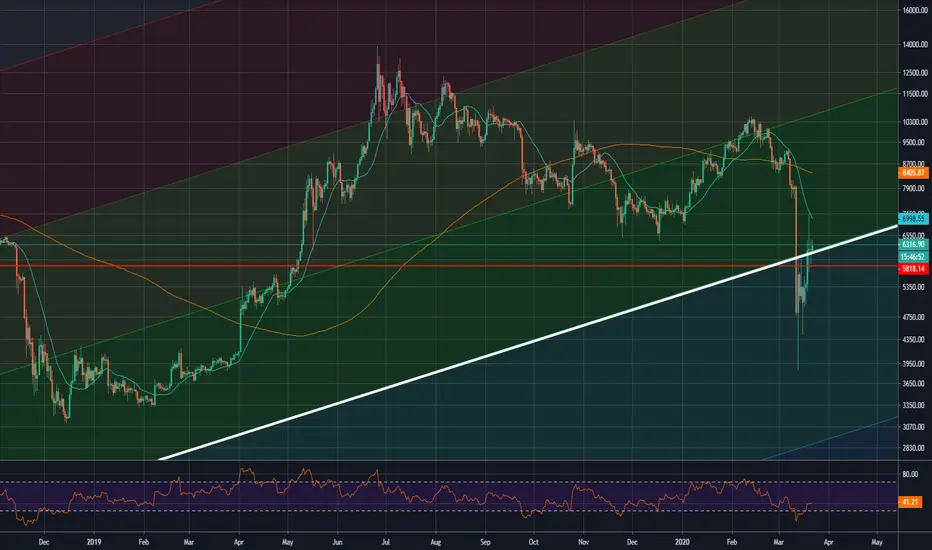
look at this one; my timing is off, but ... a dip as low as $3800, which is exactly what we just got;

in this chart the red line is the white line in the chat above; it's the same line, just different color
that chart is from May 2019; it's spot on !!
and it's easy to do; take the fib channels; pick the 2 peaks and the lowest low ... that's it
it's the long term trend line ... have a good look at it ...
last year it looked as if all the fud bulls were right and I was wrong, but by now we know better
look at this one; my timing is off, but ... a dip as low as $3800, which is exactly what we just got;
in this chart the red line is the white line in the chat above; it's the same line, just different color
that chart is from May 2019; it's spot on !!
and it's easy to do; take the fib channels; pick the 2 peaks and the lowest low ... that's it
it's the long term trend line ... have a good look at it ...
Penafian
Maklumat dan penerbitan adalah tidak dimaksudkan untuk menjadi, dan tidak membentuk, nasihat untuk kewangan, pelaburan, perdagangan dan jenis-jenis lain atau cadangan yang dibekalkan atau disahkan oleh TradingView. Baca dengan lebih lanjut di Terma Penggunaan.
Penafian
Maklumat dan penerbitan adalah tidak dimaksudkan untuk menjadi, dan tidak membentuk, nasihat untuk kewangan, pelaburan, perdagangan dan jenis-jenis lain atau cadangan yang dibekalkan atau disahkan oleh TradingView. Baca dengan lebih lanjut di Terma Penggunaan.