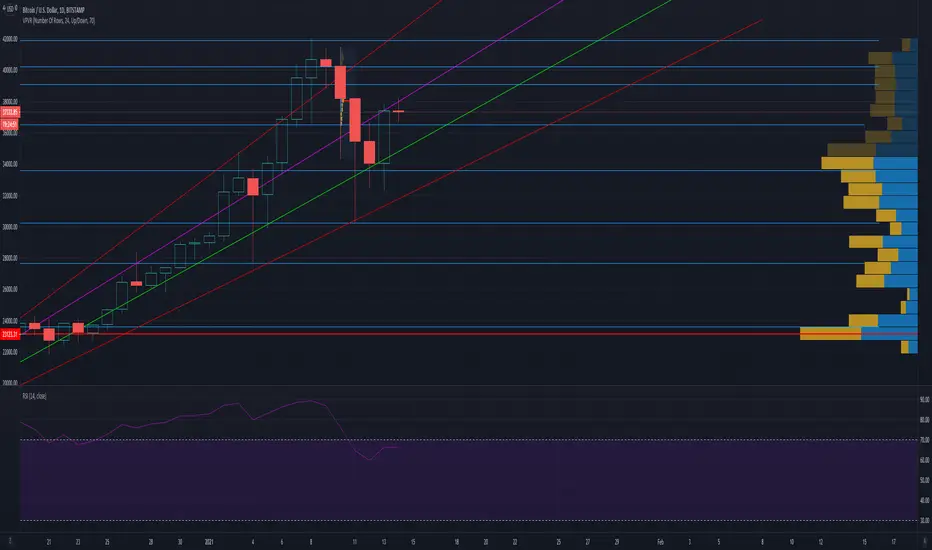
As you can see there are various lines on the graph but I will highlight what they all mean.
Top Red: Over bought Bubble
In between the Bottom Red Line and Pink Line it is a healthy run up to 100k+
If it trades below the bottom Red or close to it, is a strong buy
If it trades along the green we are good to go.
I have mapped out in horizontal blue lines the major support and resistance at each price level
Don't criticize me too much as I am only 3 and 1/2 months into TA but always love feedback ;)
Penafian
Maklumat dan penerbitan adalah tidak dimaksudkan untuk menjadi, dan tidak membentuk, nasihat untuk kewangan, pelaburan, perdagangan dan jenis-jenis lain atau cadangan yang dibekalkan atau disahkan oleh TradingView. Baca dengan lebih lanjut di Terma Penggunaan.
Penafian
Maklumat dan penerbitan adalah tidak dimaksudkan untuk menjadi, dan tidak membentuk, nasihat untuk kewangan, pelaburan, perdagangan dan jenis-jenis lain atau cadangan yang dibekalkan atau disahkan oleh TradingView. Baca dengan lebih lanjut di Terma Penggunaan.