Hello, dear friends!♥️ How are you? It's been a while since we last connected!🥹 I hope everything is going well for you, and you're ready for the upcoming halving!😏
What do we see on the Bitcoin chart today?🧐 The situation is quite intriguing. If we look at the daily chart, the scenario is not straightforward! Will there be a sharp price drop before the halving or not? What do you think? I would like to see it happen! Will it happen? We'll find out soon!
https://www.tradingview.com/x/XxsXHPyb/
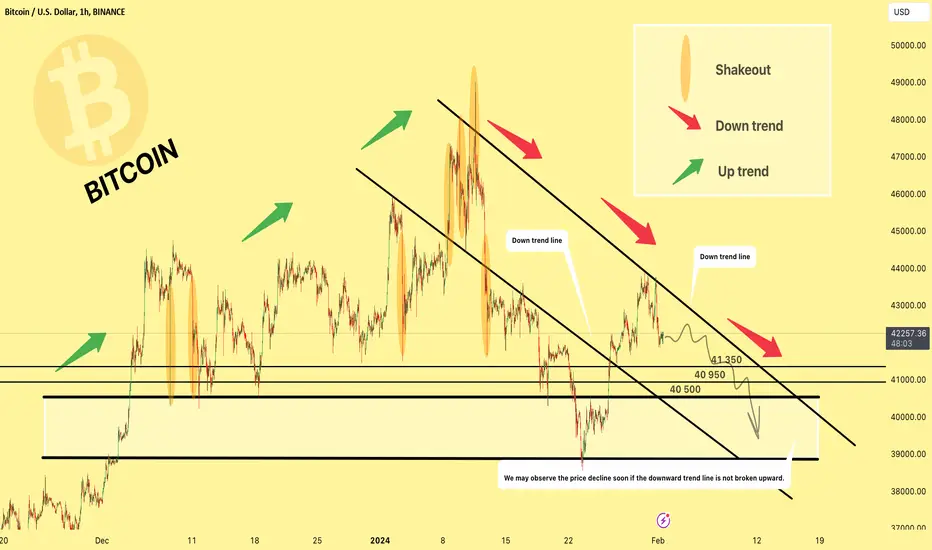
Now, regarding the hourly chart, let's take a look at my analysis! On it, we can observe that price movements have been quite turbulent (shakeouts) over the last two months, complicating short-term trades and posing a risk for margin trading! So, be cautious!
Until January 11th, an upward trend was evident on the chart, but after a sharp price drop, the trend has yet to recover (in the short term)!
By drawing a few trend lines, we can see that the price is currently moving in a descending channel and may decrease a bit more. Will there be a more significant drop below 40 thousand? In the coming days or week, if the price doesn't break above the descending channel but continues to decline, a probable scenario is a sharp drop into the range of the white rectangle at 40-39 thousand!
At the moment, this is how I see the hourly chart! I would love to hear from you in the comments for discussion!
I've missed You all dearly!🫶
Thanks for attention!💙
Sincerely yours, Kateryna💛
Penafian
Maklumat dan penerbitan adalah tidak dimaksudkan untuk menjadi, dan tidak membentuk, nasihat untuk kewangan, pelaburan, perdagangan dan jenis-jenis lain atau cadangan yang dibekalkan atau disahkan oleh TradingView. Baca dengan lebih lanjut di Terma Penggunaan.
Penafian
Maklumat dan penerbitan adalah tidak dimaksudkan untuk menjadi, dan tidak membentuk, nasihat untuk kewangan, pelaburan, perdagangan dan jenis-jenis lain atau cadangan yang dibekalkan atau disahkan oleh TradingView. Baca dengan lebih lanjut di Terma Penggunaan.