Hello everyone! 👋
In this analysis, we will explore a popular technical pattern in Bitcoin trading called the Ascending Triangle 🔺. This is a useful tool that helps us identify potential trading opportunities, especially when the market is in a consolidation phase. Let's dive deeper! 🚀
1. Ascending Triangle Pattern 📊
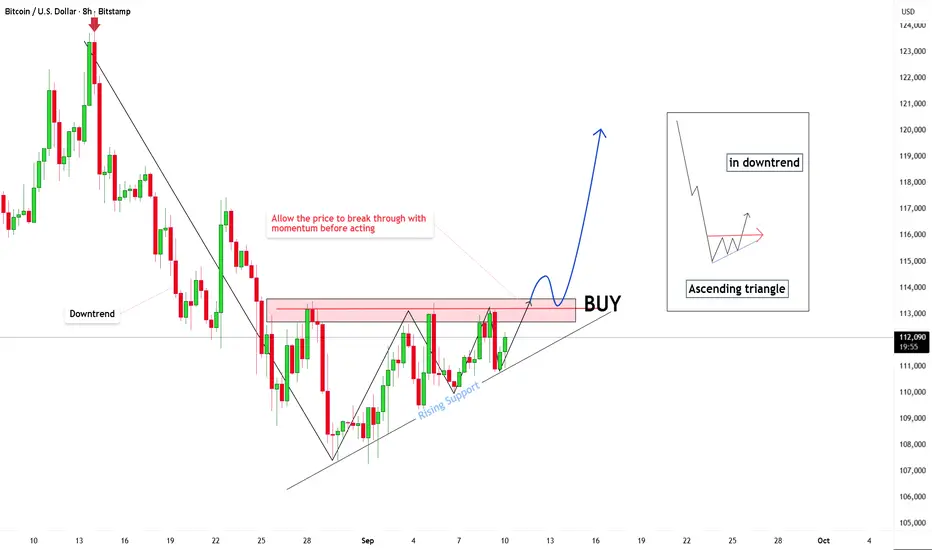
An Ascending Triangle forms when the price consistently creates higher lows but faces resistance at a fixed price level. This indicates that buyers are in control, but the market needs a strong push to break through the resistance.
2. How to Identify and Read the Pattern 🔍
Higher Lows: In an ascending triangle, the price's successive lows create rising support levels. This shows increasing buying pressure and indicates that the price can’t drop below the established support. 📈
Horizontal Resistance: The resistance level is the area where the price fails to break through for an extended period, creating a horizontal line. For Bitcoin, the current resistance level is 113,000 USD. 🚧
3. Trading Strategy 💡
Wait for a breakout: This pattern typically leads to a breakout when the price exceeds the resistance level. However, it’s crucial not to enter the trade immediately when the price approaches resistance. You should wait for confirmation when the price breaks through the resistance and is followed by a strong candlestick. 🕯️
Enter after confirmation: When the price surpasses the resistance with high volume and a strong candlestick, that’s the ideal time to enter a buy position. This reduces risk when trading. ✔️
4. Support and Resistance Levels 🔄
Resistance: The current resistance at 113,000 USD is critical. If the price breaks this level, we can expect a strong bullish movement. 💥
Support: If the price fails to break through the resistance, keep an eye on support levels like 110,000 USD or lower. When the price returns to these levels, look for signs of a recovery to find a potential buying opportunity. 💪
5. Risk Management ⚖️
Use Stop-Loss: To protect your capital, place a Stop-Loss below the nearest support level. This helps minimize risk if the price doesn’t move as expected. 🔒
Reasonable Profit Target: Set your profit target at the next resistance levels, such as 113,000 USD, 115,000 USD, and even 120,000 USD, which is currently in focus. Always control the risk-to-reward ratio in every trade. 🎯
6. Conclusion 🎓
The Ascending Triangle pattern is a powerful tool for identifying trading opportunities. However, it’s important not to rush into a trade but to wait for confirmation from the market before making a decision. Always remember to manage risk appropriately and follow your trading strategies.
Now, it’s your turn to apply this knowledge in practice. Please like this post if you’ve understood everything and are looking forward to the upcoming lessons—it will be a huge motivation for me. 👍
Wishing you all the best on your journey to becoming an expert! 🌟 Trade safely! 🛡️
In this analysis, we will explore a popular technical pattern in Bitcoin trading called the Ascending Triangle 🔺. This is a useful tool that helps us identify potential trading opportunities, especially when the market is in a consolidation phase. Let's dive deeper! 🚀
1. Ascending Triangle Pattern 📊
An Ascending Triangle forms when the price consistently creates higher lows but faces resistance at a fixed price level. This indicates that buyers are in control, but the market needs a strong push to break through the resistance.
2. How to Identify and Read the Pattern 🔍
Higher Lows: In an ascending triangle, the price's successive lows create rising support levels. This shows increasing buying pressure and indicates that the price can’t drop below the established support. 📈
Horizontal Resistance: The resistance level is the area where the price fails to break through for an extended period, creating a horizontal line. For Bitcoin, the current resistance level is 113,000 USD. 🚧
3. Trading Strategy 💡
Wait for a breakout: This pattern typically leads to a breakout when the price exceeds the resistance level. However, it’s crucial not to enter the trade immediately when the price approaches resistance. You should wait for confirmation when the price breaks through the resistance and is followed by a strong candlestick. 🕯️
Enter after confirmation: When the price surpasses the resistance with high volume and a strong candlestick, that’s the ideal time to enter a buy position. This reduces risk when trading. ✔️
4. Support and Resistance Levels 🔄
Resistance: The current resistance at 113,000 USD is critical. If the price breaks this level, we can expect a strong bullish movement. 💥
Support: If the price fails to break through the resistance, keep an eye on support levels like 110,000 USD or lower. When the price returns to these levels, look for signs of a recovery to find a potential buying opportunity. 💪
5. Risk Management ⚖️
Use Stop-Loss: To protect your capital, place a Stop-Loss below the nearest support level. This helps minimize risk if the price doesn’t move as expected. 🔒
Reasonable Profit Target: Set your profit target at the next resistance levels, such as 113,000 USD, 115,000 USD, and even 120,000 USD, which is currently in focus. Always control the risk-to-reward ratio in every trade. 🎯
6. Conclusion 🎓
The Ascending Triangle pattern is a powerful tool for identifying trading opportunities. However, it’s important not to rush into a trade but to wait for confirmation from the market before making a decision. Always remember to manage risk appropriately and follow your trading strategies.
Now, it’s your turn to apply this knowledge in practice. Please like this post if you’ve understood everything and are looking forward to the upcoming lessons—it will be a huge motivation for me. 👍
Wishing you all the best on your journey to becoming an expert! 🌟 Trade safely! 🛡️
Dagangan aktif
Penerbitan berkaitan
Penafian
Maklumat dan penerbitan adalah tidak bertujuan, dan tidak membentuk, nasihat atau cadangan kewangan, pelaburan, dagangan atau jenis lain yang diberikan atau disahkan oleh TradingView. Baca lebih dalam Terma Penggunaan.
Penerbitan berkaitan
Penafian
Maklumat dan penerbitan adalah tidak bertujuan, dan tidak membentuk, nasihat atau cadangan kewangan, pelaburan, dagangan atau jenis lain yang diberikan atau disahkan oleh TradingView. Baca lebih dalam Terma Penggunaan.