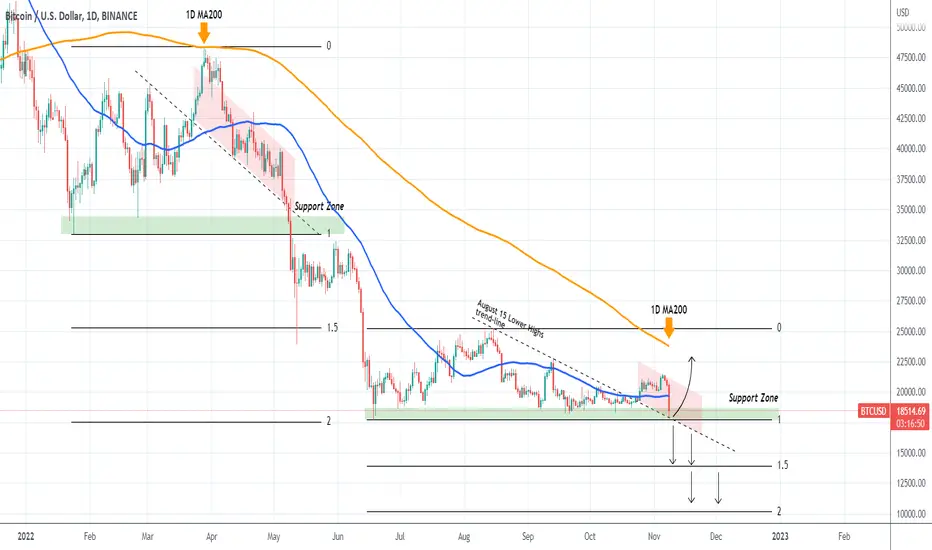
Bitcoin (BTCUSD) is following the overall panic sentiment of the market after the Binance news and tested the Support Zone of the June 18 Low. A break below can set in motion a sell-off similar to that of May 09, which first hit the 1.5 Fibonacci extension and after some consolidation, moved to make the June 18 Low on the 2.0 Fibonacci extension.
What stood out then as the trigger of the sell-off was a Lower Highs trend-line that started on March 02 and then turned into Lower Lows that held the price action until the Support Zone. When it broke, the aggressive sell-off took place. On today's sequence, we have that (former) Lower Highs trend-line starting on the August 15 High, getting hit today on the Binance exchange.
A break below it can trigger that same massive sell-off with the 1.5 Fib extension being around 14000 and 2.0 around 10200. Another common characteristic of the two fractals is the fact that the 1D MA200 (orange trend-line) was never broken and acted as a Resistance. That means that technically only a break above it can invalidate this bearish pattern.
So what do you think? Can the former Lower Highs trend-line save the day? Feel free to let me know in the comments section below!
-------------------------------------------------------------------------------
** Please LIKE 👍, SUBSCRIBE ✅, SHARE 🙌 and COMMENT ✍ if you enjoy this idea! Also share your ideas and charts in the comments section below! This is best way to keep it relevant, support me, keep the content here free and allow the idea to reach as many people as possible. **
-------------------------------------------------------------------------------
You may also TELL ME 🙋♀️🙋♂️ in the comments section which symbol you want me to analyze next and on which time-frame. The one with the most posts will be published tomorrow! 👏🎁
-------------------------------------------------------------------------------
👇 👇 👇 👇 👇 👇
💸💸💸💸💸💸
👇 👇 👇 👇 👇 👇
👑Best Signals (Forex/Crypto+70% accuracy) & Account Management (+20% profit/month on 10k accounts)
💰Free Channel t.me/tradingshotglobal
🤵Contact info@tradingshot.com t.me/tradingshot
🔥New service: next X100 crypto GEMS!
💰Free Channel t.me/tradingshotglobal
🤵Contact info@tradingshot.com t.me/tradingshot
🔥New service: next X100 crypto GEMS!
Penafian
Maklumat dan penerbitan adalah tidak dimaksudkan untuk menjadi, dan tidak membentuk, nasihat untuk kewangan, pelaburan, perdagangan dan jenis-jenis lain atau cadangan yang dibekalkan atau disahkan oleh TradingView. Baca dengan lebih lanjut di Terma Penggunaan.
