I've compared Bitcoin's current cycle to that of 2011 - 2013 more than a dozen times but it never fails to deliver. The May sharp correction gave more validity to such comparisons as that sell-off and subsequence accumulation phase drew many similarities to that of April - August 2013. Now, even though the current Cycle is longer as not only 2011 - 2013 was the first full BTC Cycle, but also the Lengthening Cycles Theory (LCT) suggests that each Cycle lasts longer with diminishing returns.
This time I've added some more elements to the last time I compared the two:
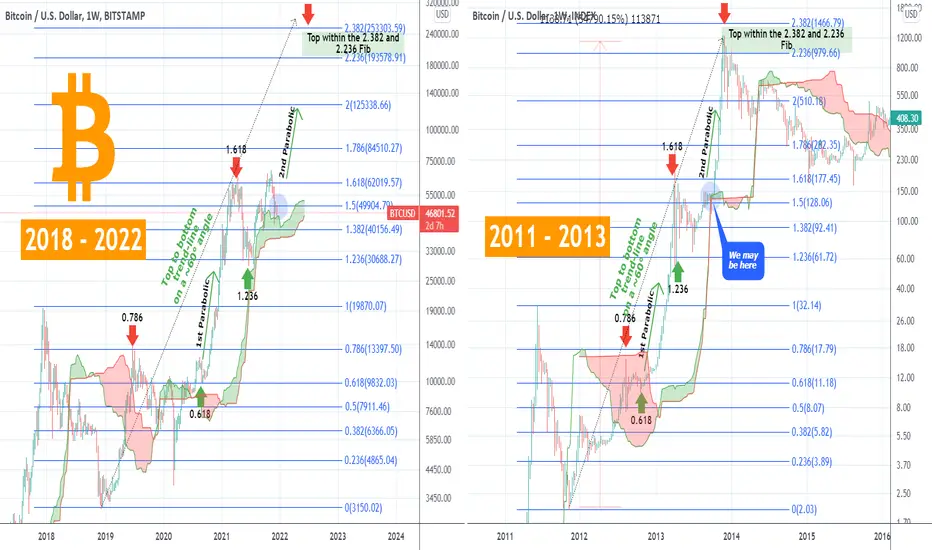
* First of all I've plotted all the basic Fibonacci retracement and extension levels, in order to identify key pressure points and similarities between the two cycles. As you see during the initial rise of the Bull Cycle, both took a first stop and rejection on the 0.786 Fib and the true 1st Phase of the Parabolic Rally started after the 0.618 Fib held. Then in the mid-phase, BTCUSD took a second stop and rejection around the 1.618 Fib and bottomed and recovered on the 1.236 Fib. We are currently around the 1.5 Fib (as displayed by the blue circle), which in September 2013 was where the price consolidated, held and started the 2nd (and final) Phase of the Parabolic Rally. The Cycle's top took place within the 2.382 and 2.236 Fibonacci extension levels.
* Secondly, I've added the always useful Ichimoku Cloud. As seen, the first red area on both Cycles was when the first stop on the 0.786 Fib took place and the green that followed after the 0.618 (notable exception is the period of the COVID market melt-down which distorted the charts). The Ichimoku turned sideways around the 1.5 Fib, which is where we are at right now.
* Last but not least, I've inserted the element of Top to Bottom on an Angle with a trend-line (dotted line on the chart) that starts from the Bottom of the Bear Cycle and ends at the Top of the Bull Cycle. In 2011 - 2013 that line was on roughly on a 60° angle and touched exactly (excluding the big wick on that April 08 2013 1W candle) the 1.618 Fib top of the final accumulation phase. If we do the same projection on the current (2018 - 2022) Cycle, then remarkably the very same 60° angle trend-line also makes direct contact with the 1.618 Fib and lands on the 2.382 Top at the start of April 2022.
From all the above we can come to a conclusion that the Bull Run is very much alive and ongoing. The current spot we are in places us right before a strong (the 2nd) monthly Parabolic Rally which aims within the 2.236 (roughly $193k) and 2.382 (roughly $250k) Fibonacci levels. Now, as for the April 2022 projection, it is very hard to estimate the timing especially if the Lengthening Cycles Theory holds. But still, it is something we can keep in mind.
So what's your take on today's analysis? Does this help at clearing things up and are you expecting a strong rally early in 2022 or history will be different this time?
Feel free to share your work and let me know in the comments section!
--------------------------------------------------------------------------------------------------------
Please like, subscribe and share your ideas and charts with the community!
--------------------------------------------------------------------------------------------------------
This time I've added some more elements to the last time I compared the two:
* First of all I've plotted all the basic Fibonacci retracement and extension levels, in order to identify key pressure points and similarities between the two cycles. As you see during the initial rise of the Bull Cycle, both took a first stop and rejection on the 0.786 Fib and the true 1st Phase of the Parabolic Rally started after the 0.618 Fib held. Then in the mid-phase, BTCUSD took a second stop and rejection around the 1.618 Fib and bottomed and recovered on the 1.236 Fib. We are currently around the 1.5 Fib (as displayed by the blue circle), which in September 2013 was where the price consolidated, held and started the 2nd (and final) Phase of the Parabolic Rally. The Cycle's top took place within the 2.382 and 2.236 Fibonacci extension levels.
* Secondly, I've added the always useful Ichimoku Cloud. As seen, the first red area on both Cycles was when the first stop on the 0.786 Fib took place and the green that followed after the 0.618 (notable exception is the period of the COVID market melt-down which distorted the charts). The Ichimoku turned sideways around the 1.5 Fib, which is where we are at right now.
* Last but not least, I've inserted the element of Top to Bottom on an Angle with a trend-line (dotted line on the chart) that starts from the Bottom of the Bear Cycle and ends at the Top of the Bull Cycle. In 2011 - 2013 that line was on roughly on a 60° angle and touched exactly (excluding the big wick on that April 08 2013 1W candle) the 1.618 Fib top of the final accumulation phase. If we do the same projection on the current (2018 - 2022) Cycle, then remarkably the very same 60° angle trend-line also makes direct contact with the 1.618 Fib and lands on the 2.382 Top at the start of April 2022.
From all the above we can come to a conclusion that the Bull Run is very much alive and ongoing. The current spot we are in places us right before a strong (the 2nd) monthly Parabolic Rally which aims within the 2.236 (roughly $193k) and 2.382 (roughly $250k) Fibonacci levels. Now, as for the April 2022 projection, it is very hard to estimate the timing especially if the Lengthening Cycles Theory holds. But still, it is something we can keep in mind.
So what's your take on today's analysis? Does this help at clearing things up and are you expecting a strong rally early in 2022 or history will be different this time?
Feel free to share your work and let me know in the comments section!
--------------------------------------------------------------------------------------------------------
Please like, subscribe and share your ideas and charts with the community!
--------------------------------------------------------------------------------------------------------
👑Best Signals (Forex/Crypto+70% accuracy) & Account Management (+20% profit/month on 10k accounts)
💰Free Channel t.me/tradingshotglobal
🤵Contact info@tradingshot.com t.me/tradingshot
🔥New service: next X100 crypto GEMS!
💰Free Channel t.me/tradingshotglobal
🤵Contact info@tradingshot.com t.me/tradingshot
🔥New service: next X100 crypto GEMS!
Penafian
Maklumat dan penerbitan adalah tidak dimaksudkan untuk menjadi, dan tidak membentuk, nasihat untuk kewangan, pelaburan, perdagangan dan jenis-jenis lain atau cadangan yang dibekalkan atau disahkan oleh TradingView. Baca dengan lebih lanjut di Terma Penggunaan.