📊 Weekly Technical Levels
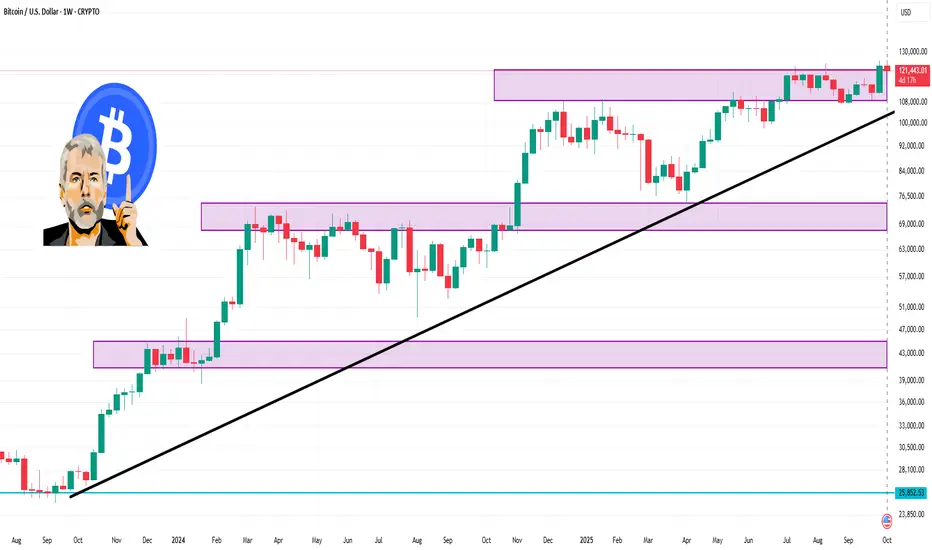
Resistance Levels:
$124,652.59
$127,266.08
$129,248.44
Support Levels:
$120,056.73
$118,074.38
$115,460.88
These levels are based on Barchart's technical analysis and are derived from the most recent data available.
📈 Technical Indicators
Relative Strength Index (RSI): The RSI is currently at 61.95%, indicating that Bitcoin is neither overbought nor oversold.
Stochastic Oscillator: Both the %K and %D lines are in the 80% range, suggesting that Bitcoin is in an overbought condition, which could precede a pullback.
Average True Range (ATR): The 9-day ATR is 3,316.77, indicating a daily price movement of approximately 2.73%.
Directional Movement Index (DMI): The +DI is at 35.72, and the -DI is at 10.17, suggesting a strong bullish trend.
🔮 Market Outlook
Analysts project that Bitcoin may reach up to $126,865 within the next week, with a potential target of $129,753 over the next four weeks.
⚠️ Risk Considerations
While the long-term outlook appears bullish, it's essential to monitor key support levels. A drop below $120,000 could signal a short-term correction. Additionally, the stochastic oscillator indicates an overbought condition, which may lead to a pullback.
Penerbitan berkaitan
Penafian
Maklumat dan penerbitan adalah tidak bertujuan, dan tidak membentuk, nasihat atau cadangan kewangan, pelaburan, dagangan atau jenis lain yang diberikan atau disahkan oleh TradingView. Baca lebih dalam Terma Penggunaan.
Penerbitan berkaitan
Penafian
Maklumat dan penerbitan adalah tidak bertujuan, dan tidak membentuk, nasihat atau cadangan kewangan, pelaburan, dagangan atau jenis lain yang diberikan atau disahkan oleh TradingView. Baca lebih dalam Terma Penggunaan.