ROS #Repeat of structure
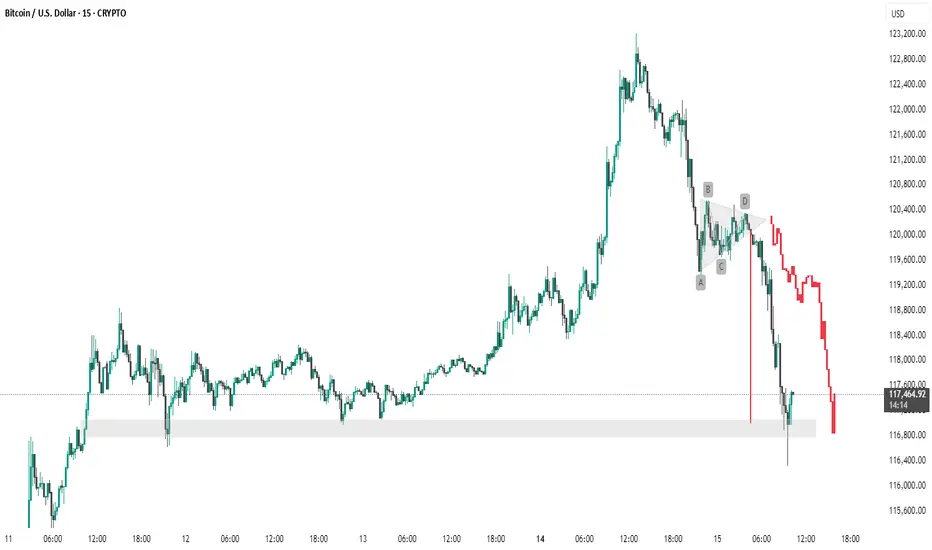
The chart you've provided is a 15-minute candlestick chart of **Bitcoin (BTC) / USD**, showing a recent price action pattern followed by a significant drop. Here are the **key points** identified on the chart:
**Key Support Zone**
* Highlighted in **light gray** at the bottom.
* Range: **\~116,800 to \~117,500 USD**
* This zone has acted as **support multiple times** (seen around July 11–12 and now again on July 15).
* Price **bounced** off this area during the most recent dip, but the current candle is testing it again.
---
**Chart Pattern: Bearish Triangle (ABCD Structure)**
Marked by the labels **A, B, C, D**, forming a **descending triangle**, typically a **bearish continuation pattern**:
* **A to B:** Sharp drop (initial leg down).
* **B to C:** Rebound, but fails to reclaim highs.
* **C to D:** Tightening price action inside the triangle.
* After **D**, there’s a **breakdown**, leading to heavy selling.
---
**Breakdown and Sharp Decline**
* Price **breaks below the triangle support** with a long red candle.
* Massive sell-off continues, pushing BTC below **\$118,000**.
* The current price is around **\$117,481**, hovering near the key support zone.
---
**Trend Observation**
* Before the triangle, there was a **strong uptrend** leading up to \~\$123,000.
* The triangle acted as a **distribution zone** before the **reversal** began.
* The trend has shifted from **bullish** to **bearish** post-pattern.
---
🔍 Summary of Key Levels:
| Level Type | Price Range |
| ---------------- | ------------------- |
| Resistance (Top) | \~\$123,000 |
| Breakdown Point | \~\$120,400 |
| Support Zone | \~\$116,800–117,500 |
thanking u
Penafian
Maklumat dan penerbitan adalah tidak dimaksudkan untuk menjadi, dan tidak membentuk, nasihat untuk kewangan, pelaburan, perdagangan dan jenis-jenis lain atau cadangan yang dibekalkan atau disahkan oleh TradingView. Baca dengan lebih lanjut di Terma Penggunaan.
Penafian
Maklumat dan penerbitan adalah tidak dimaksudkan untuk menjadi, dan tidak membentuk, nasihat untuk kewangan, pelaburan, perdagangan dan jenis-jenis lain atau cadangan yang dibekalkan atau disahkan oleh TradingView. Baca dengan lebih lanjut di Terma Penggunaan.