Each Low to ATH has a "Local" Fib extension Set
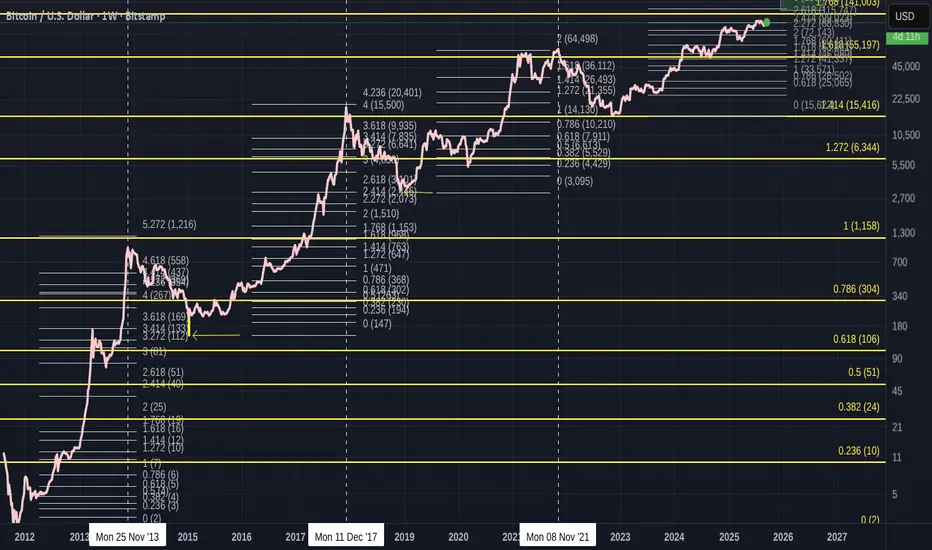
And the Yellow Fib extension is from the 2011 Low to the 2013 ATH and I use this as a "Global" Fib as that was, in reality, the first ever Low to ATH before a sustained draw back.
Please Note that as Candles would not show very clearly at this scale, I have used a Line. This has some inaccuracy as to true candle Ends. As a result, it looks like some Fibs are misplaced but I assure you, each are placed accurately, using candles and then the Line is used.
The Fibs are accuratly placed.
Local Fib extension ATH Fib number
2013 November - 5.272
2017 December - 4.236
2021 November - 2
2025 Current just above 2.618
Global Fib extension ATH number
NOTE- See on chart how ATH is just above this Fib level, except for Fib 1.
2013 November - 1
2017 December- 1.414
2021 November - 1.618
2025 Current Fib just below 1,758 - if we follow trend, I expect ATH to be using this 1.768 line, the next in sequence of Fib numbers.
Local Fib charts
2011 low to 2013 ATH
2015 low to 2017 ATH
2019 low to 2021 ATH
2023 low to current position
To me, there are a number of things to see here.
More than anything, what is plain to see is how Bitcoin has used the Global Fib numbers like stepping Stones. Currently just below the 1.768, which is the next in sequence. ( Yellow lines )
All but the First ATH were recorded just above the Global Fib lines ( the First was on the line ) and I have little doubt we will do this again.
And if we look at the pattern of the Local Fib lines, we can see that we missed the 3.236 line in 2021
We went from 5 to 4 to 2. ( ignoring the 236 bit for now.)
We missed 3
See how the first 2 Local Fibs dropped by nearly one complete Fib number, from 5.272 to 4.236
By the time we headed towards the 2021 ATH, the market accelerated hugely, mostly due to the idea of Get Rich quick and no tax rules..GREED WAS UPMOST.
Even at the time, I considered this cycle Abnormal. Many charts show why, and I will not expand further here.
The Local Fib level for that run was distorted by the swift recovery from the low in 2019.
While this was not a bad thing, it changed the cycle dynamics.
This cycle, currently, we have returned to a more sensible approach and we appear to be heading to the 3 local Fib zone, maybe as we should have done in 2021.
This also happens to be just above the 1.768 Global Fib line, The next expected Global ATH line.
So, we are currently approaching that 1.7668 Global Fib line and we can expect the ATH to be above this, if we follow the previous 2 ATH.
And if we go above that Global line the same as we have in the last 2 previous cycles, we find the Local 3 Fib extension.
IF we were to follow previous, this could be expected ro be the 3.236, at around 190K
I think this is doubtful and maybe the 3 itself is more realistic at 155K
So, there you have it.
Bitcoin and its Fibs have a pattern, it get broken and it looks like it is trying to regain that pattern.
And this is all done by Humans trading........
Astounding.
and that 2 Global Fin line in 2029 ? Will we get there ?
Given the introductions of ETF and Corprate Long term holders....Will we see a bear market before we rech that 2 Global Fib ?
So many questions...
One real answer is BUY BITCOIN AND HOLD ON TO IT
Nothing to be taken as Financial advice.
I will always say
"Only invest what you can afford to loose. When you are ready, take out your original investment. This way, it is only your profit that is at risk"
THAT is Financial advice
I will always say
"Only invest what you can afford to loose. When you are ready, take out your original investment. This way, it is only your profit that is at risk"
THAT is Financial advice
Penafian
Maklumat dan penerbitan adalah tidak dimaksudkan untuk menjadi, dan tidak membentuk, nasihat untuk kewangan, pelaburan, perdagangan dan jenis-jenis lain atau cadangan yang dibekalkan atau disahkan oleh TradingView. Baca dengan lebih lanjut di Terma Penggunaan.