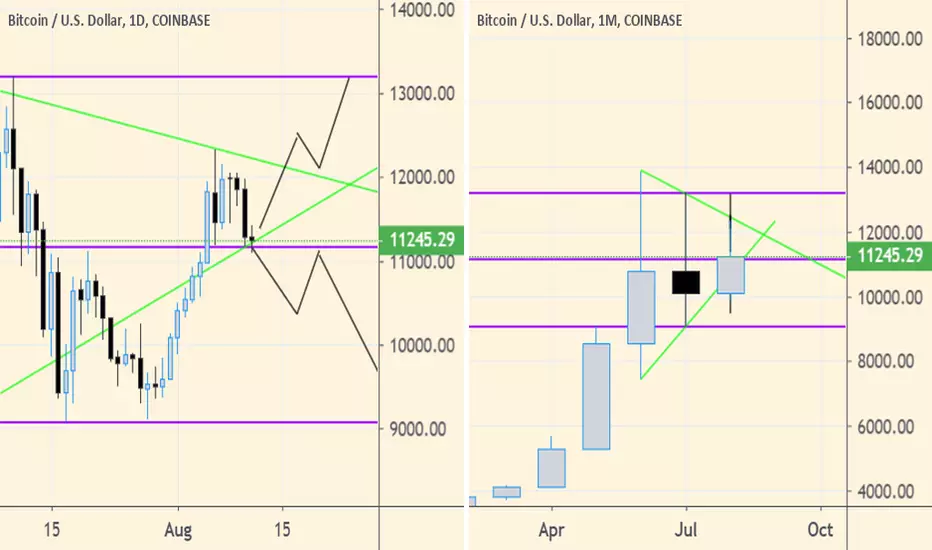
Here are two possible paths Bitcoin could take.
On the monthly chart we see a bearish Harami, usually forming at the end of an uptrend, indicating a possible reversal. However, the smaller the second candle the likelier the reversal.
We have crossed the middle line and are retesting it on the 1D time-frame and are retesting it. A consolidation here would make sense too, between both the green lines which represent the monthly resistance and support zones.
All the best!
- heish
Penerbitan berkaitan
Penafian
Maklumat dan penerbitan adalah tidak dimaksudkan untuk menjadi, dan tidak membentuk, nasihat untuk kewangan, pelaburan, perdagangan dan jenis-jenis lain atau cadangan yang dibekalkan atau disahkan oleh TradingView. Baca dengan lebih lanjut di Terma Penggunaan.
Penerbitan berkaitan
Penafian
Maklumat dan penerbitan adalah tidak dimaksudkan untuk menjadi, dan tidak membentuk, nasihat untuk kewangan, pelaburan, perdagangan dan jenis-jenis lain atau cadangan yang dibekalkan atau disahkan oleh TradingView. Baca dengan lebih lanjut di Terma Penggunaan.