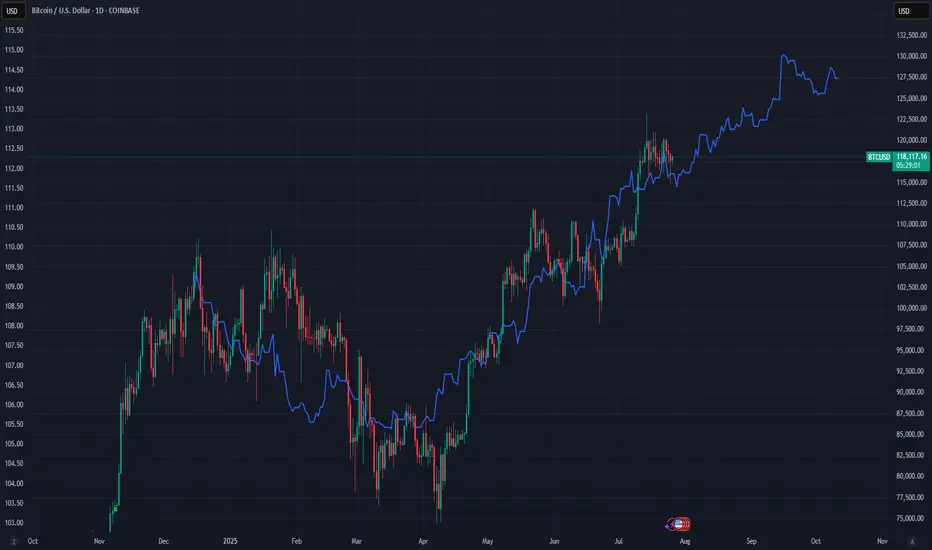
This chart compares Bitcoin’s price (daily) with a Global M2 indicator that includes the monetary supply of major economies like the U.S., Eurozone, China, and Japan.
It’s not a perfect global measure — but it gives us a reliable macro signal of what global liquidity is doing.
And when it comes to Bitcoin, liquidity is everything.
Why this matters:
Bitcoin is often seen as volatile or unpredictable. But when we zoom out and overlay it with liquidity flows (like M2), a powerful pattern emerges:
Bitcoin tends to follow global M2 with a ~10-week lag.
When M2 rises, Bitcoin often rallies weeks later. When M2 contracts, Bitcoin loses momentum.
This makes M2 a powerful leading indicator — not for predicting exact price levels, but for catching the direction of trend and regime shifts.
What this chart tells us:
This is the same logic used by macro strategists like Raoul Pal: liquidity drives everything.
Important disclaimer:
This doesn’t mean M2 tells you where price will be on a specific date. But it can help identify turning points — and confirm whether we’re in a reflationary vs contractionary environment.
Think of it as a weather forecast, not a GPS pin.
In other words:
This chart doesn't show the price. It shows the future.
It’s not a perfect global measure — but it gives us a reliable macro signal of what global liquidity is doing.
And when it comes to Bitcoin, liquidity is everything.
Why this matters:
Bitcoin is often seen as volatile or unpredictable. But when we zoom out and overlay it with liquidity flows (like M2), a powerful pattern emerges:
Bitcoin tends to follow global M2 with a ~10-week lag.
When M2 rises, Bitcoin often rallies weeks later. When M2 contracts, Bitcoin loses momentum.
This makes M2 a powerful leading indicator — not for predicting exact price levels, but for catching the direction of trend and regime shifts.
What this chart tells us:
- M2 leads, Bitcoin follows.
- The curves won’t align perfectly — but the macro structure is there.
- Big expansions in M2 create a friendlier environment for risk assets like BTC.
This is the same logic used by macro strategists like Raoul Pal: liquidity drives everything.
Important disclaimer:
This doesn’t mean M2 tells you where price will be on a specific date. But it can help identify turning points — and confirm whether we’re in a reflationary vs contractionary environment.
Think of it as a weather forecast, not a GPS pin.
In other words:
This chart doesn't show the price. It shows the future.
Penafian
Maklumat dan penerbitan adalah tidak dimaksudkan untuk menjadi, dan tidak membentuk, nasihat untuk kewangan, pelaburan, perdagangan dan jenis-jenis lain atau cadangan yang dibekalkan atau disahkan oleh TradingView. Baca dengan lebih lanjut di Terma Penggunaan.
Penafian
Maklumat dan penerbitan adalah tidak dimaksudkan untuk menjadi, dan tidak membentuk, nasihat untuk kewangan, pelaburan, perdagangan dan jenis-jenis lain atau cadangan yang dibekalkan atau disahkan oleh TradingView. Baca dengan lebih lanjut di Terma Penggunaan.