I'm saying this move will BEGIN within the next 22 hours. I'm NOT saying we will be up $1,500 22 hours from now. Posting a screenshot of the cover chart below for easier viewing. If this is too noisy of a chart for you, I'm sorry. It's NOT too noisy for me. It makes perfect sense if you are familiar with the indicators. Don't forget we have a HUGE CME Gap to be filled on it's Daily TF. 
If you have not seen recent updates on the 90 minute, 3 hour and 6 hour time frames, have a look at personal updates section in the following publication:
"6h & 12h Candles Are Aligning With 24h Candle to Turn Up Soon."

Here's the publication posted previously on the CME Gap on the Daily:

If you have not seen recent updates on the 90 minute, 3 hour and 6 hour time frames, have a look at personal updates section in the following publication:
"6h & 12h Candles Are Aligning With 24h Candle to Turn Up Soon."
Here's the publication posted previously on the CME Gap on the Daily:
Nota
Let's have a look at the Weekly Time Frame WITH Indicators:Here is the Weekly WITHOUT Indicators:
Nota
SOME ARE NOT PAYING ATTENTION: Note I provided clarification by stating the $1,500 move will BEGIN within 22 hours. NOT that we will be $1,500 higher than where we are now within 22 hours.Nota
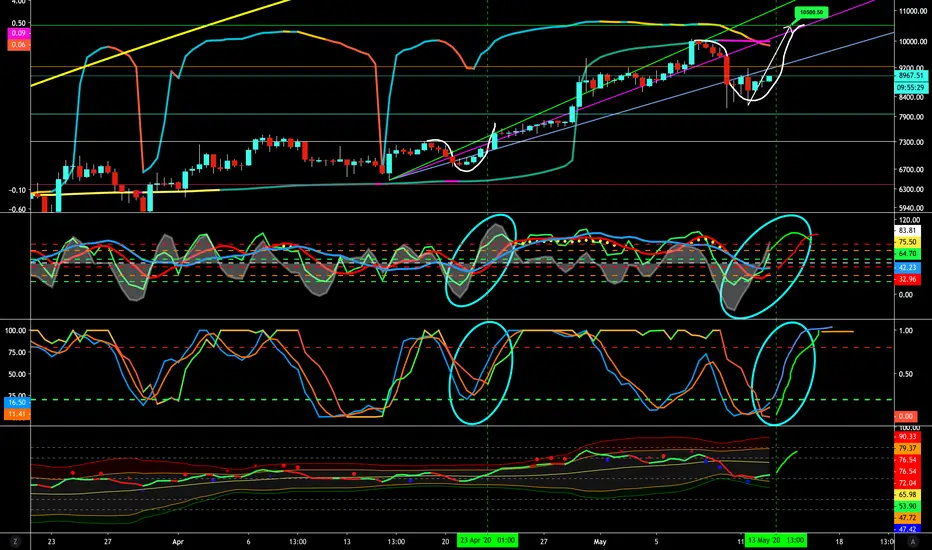
It appears (WHEN LOOKING AT THE 12 HOUR) we not only have potential of a boost up in price when the Red RSI makes contact with the Green Line WHILE the Green Line is going up; indicating upward pressure; BUT WE ALSO stand a CHANCE of a boost when the Red RSI crosses above the 50% level AFTER it made contact with the Green Line going up EARLIER. It's hard to say if the Red RSI will make contact with the 50% level the second 12h candle of May 13, 2020 -OR- the first 12h candle on May 14, 2020.Nota
"Bitcoin CME Futures: Those Who Will Short; BEWARE!" 
Nota
"Three Scenarios on the Way to December, 2020."
Nota
I need to get some sleep... Happy Trading and Stay Awesome!Nota
First initial burst of energy upward in the 12 hour time frame occurs under certain conditions in multiple time frames being met and carried out once the Red RSI makes contact with the Green Line WHILE the Green Line is going up: indicating upward pressure is about to ensue (follow). This is identified with the Green vertical time lines I manually placed on the chart.Second initial burst of energy upward in the 12 hour time frame occurs under certain conditions in multiple time frames being met and comes to fruition in varying degrees once the Red RSI crosses above the 50% level. This phenomenon is identified with the magenta vertical time lines I manually placed on the chart.
Here's the 12 hour time frame:
Nota
Nota
I'm going to emphasize previous point once again with the chart below. Be sure to pay close attention to WHERE I placed Green Vertical Time Lines and Magenta Vertical Time Lines.First initial burst of energy upward in the 12 hour time frame occurs under certain conditions in multiple time frames being met and carried out once the Red RSI makes contact with the Green Line WHILE the Green Line is going up: indicating upward pressure is about to ensue (follow). This is identified with the Green vertical time lines I manually placed on the chart.
Second initial burst of energy upward in the 12 hour time frame occurs under certain conditions in multiple time frames being met and comes to fruition in varying degrees once the Red RSI crosses above the 50% level. This phenomenon is identified with the magenta vertical time lines I manually placed on the chart.
Here's the 12 hour time frame:
Nota
Sorry for so many posts... I've only had about 5 hours of sleep. I changed one line from Green TO YELLOW because other conditions were not met in other time frames for the price action here in the 12h TF to have a chance of rising considerably. I also ADDED a Green Line where the Red RSI made contact with the Green Line WHILE the Green Line was going up; indicating upward pressure about to ensue (follow) on 22 Apr. 2020.Nota
I'm about to get a bite to eat. Before I go, I wanted to post the CME Bitcoin Futures Idea here in case any of you have not seen it yet. It too supports CONTINUED upward pressure. Now I'm off to eat...Happy Trading and Stay Awesome!
Nota
I'm about to go out for a walk with my wife and son to get some sunlight. Before I do, I wanted to point out what is playing out with the Green Line and White Energy in the Weekly Time Frame. You KNOW since the Red RSI in the Weekly has CLOSED above 56 percent, we do NOT have a chance for a sustained reversal in pressure until the White Energy comes down to the 50% level. Since this is the case, it will be HIGHLY LIKELY we continue with upward pressure for the Mid Term to the end of May or early June before we have a chance of a consolidation event of 35% or more. Going out for my walk now...Stay Awesome!
Nota
I posted this Weekly chart in this publication 18 hours ago. COMPARE the Green Line and White Energy as the price continues to rise...Nota
New 12 hour candle coming up shortly:Nota
We know our TIME is valuable! Sorry if all the lines and indicators is "too much" or "too busy" for some here. It may even appear daunting when looking at it and people think, "It's impossible for me to learn all of that." WHEN THAT IS FURTHER FROM THE CASE. Some may say, "I don't have the TIME for that." In which case we know that person has reached a crossroad of decision. What decision is that? "One can make a living working hard on their job -OR- one can make a fortune working hard on themselves!"
Fortunes are made by investing TIME. The more TIME we invest in a thing, the more VALUABLE our TIME becomes as we LEARN that thing. That VALUE is not only a means of evaluating ourselves. The knowledge and experience we've gained can also be of VALUE to others. Not to take advantages of others or price gouge. Simply to make an honest wage for TIME invested in order to reap rewards for that TIME and prepare for retirement in the future.
If one will invest their TIME to grasping this, it will pay great dividends in the future. Of course, it's NOT going to be easily absorbed for most people. However, with REPETITION and PERSISTENCE you WILL climb the peak of Mount Analyst. It's within your reach. You just have to be willing to take the first steps and KEEP ON STEPPING. NEVER GIVE UP!!!
Stay Awesome!
David
Nota
Posting the 12h once again... The text bubbles are un-changed. I simply want a record of the Red RSI crossing above 50% level in the beginning of the current 12h Candle and post another screenshot later at the end of the current 12h candle.Nota
Here is an EXCELLENT VISUAL of why it's so important to use GROUPS of time frames within a Trend. For within this VISUAL you see trends, within trends, within trends; depending on the time frames used of course to see the near term, mid term and long term outlook. Thanks Alexander_Nikitin
Nota
If you are looking to go long here, wait for a potential dip.Here's the 6 hour TF:
Here's the 3 hour TF:
Nota
3-Day Time Frame: Nota
An example of what I mean by I'm expecting the Stochastic RSI to bounce back up soon in the 3-Day TF. Especially, with the price action going up already in the current 3-Day Candle. The Stochastic WILL bounce right back up the next Candle because of how high the price action has gone up already in the current 3-Day Candle:Nota
Added a couple of "Date Range" measurements to this 3-Day Chart:Nota
Weekly - Pulled Back View:Weekly - Local View:
Nota
A simple update on what was ANTICIPATED in the 12 hour time frame as REPETITION:Nota
CME Gap almost filled. However, WE WILL KEEP RISING after a PAUSE... The Weekly shows too much room for upward pressure to fizzle out now... This should continue in spurts till last week of May or first week of June.Penafian
Maklumat dan penerbitan adalah tidak dimaksudkan untuk menjadi, dan tidak membentuk, nasihat untuk kewangan, pelaburan, perdagangan dan jenis-jenis lain atau cadangan yang dibekalkan atau disahkan oleh TradingView. Baca dengan lebih lanjut di Terma Penggunaan.
Penafian
Maklumat dan penerbitan adalah tidak dimaksudkan untuk menjadi, dan tidak membentuk, nasihat untuk kewangan, pelaburan, perdagangan dan jenis-jenis lain atau cadangan yang dibekalkan atau disahkan oleh TradingView. Baca dengan lebih lanjut di Terma Penggunaan.