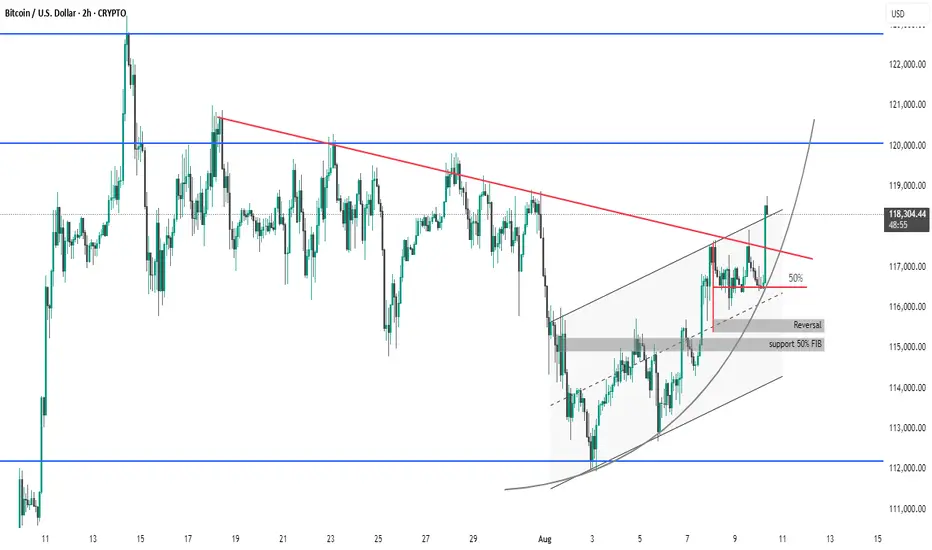
Bitcoin (BTC/USD) 2-hour chart presents several key technical observations:
Breakout Confirmed: Price has successfully broken above the descending red trendline, signaling a potential bullish breakout.
Ascending Channel: BTC is trading within an upward-sloping channel, indicating a strong short-term uptrend.
Support Zones: Multiple supports around $115,000 are identified, including:
50% Fibonacci retracement
Previous reversal zone
Momentum: The current price action has surged past the 50% midline of the channel and is targeting higher resistance levels around $120,000.
Curved Trendline: An upward parabolic curve suggests accelerating bullish momentum.
Summary: Bitcoin is showing strong bullish momentum after breaking key resistance. Watch for a potential retest of the breakout level (~$117,000) before a move higher.
thanks you
Penerbitan berkaitan
Penafian
Maklumat dan penerbitan adalah tidak dimaksudkan untuk menjadi, dan tidak membentuk, nasihat untuk kewangan, pelaburan, perdagangan dan jenis-jenis lain atau cadangan yang dibekalkan atau disahkan oleh TradingView. Baca dengan lebih lanjut di Terma Penggunaan.
Penerbitan berkaitan
Penafian
Maklumat dan penerbitan adalah tidak dimaksudkan untuk menjadi, dan tidak membentuk, nasihat untuk kewangan, pelaburan, perdagangan dan jenis-jenis lain atau cadangan yang dibekalkan atau disahkan oleh TradingView. Baca dengan lebih lanjut di Terma Penggunaan.