⊣
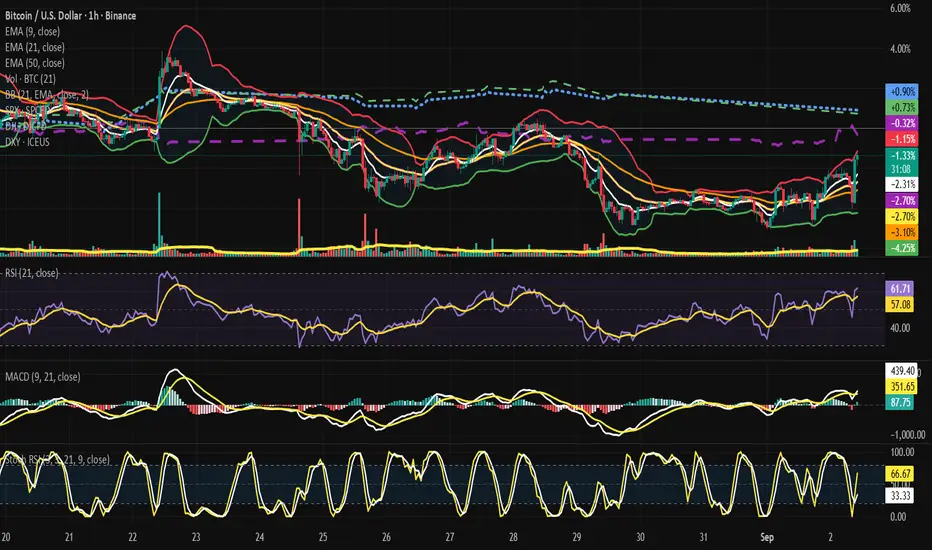
⟁ BTC/USD – BINANCE – (CHART: 1H) – (Sep 02, 2025).
◇ Analysis Price: $111,256.57.
⊣
⨀ I. Temporal Axis – Strategic Interval – (1H):
▦ EMA9 – (–2.78%):
∴ Price trading above EMA9 after recovery;
∴ Short-term bullish tilt, but EMA slope still negative;
∴ Needs sustained closes above to confirm momentum.
✴️ Conclusion: EMA9 = fragile bullish reclaim.
⊢
▦ EMA21 – (–3.06%):
∴ Mid-term intraday resistance;
∴ Price hovering above, but EMA slope negative;
∴ Confirms cautious recovery, not yet trend reversal.
✴️ Conclusion: EMA21 = tactical battleground.
⊢
▦ EMA50 – (–3.40%):
∴ Still trending lower;
∴ Acts as structural resistance in case of rejection;
∴ Price must conquer this line for sustainable recovery.
✴️ Conclusion: EMA50 = resistance wall.
⊢
▦ BB (21,2, basis = EMA9) – (Upper ~ –1.63% / Midline ~ –3.06% / Lower ~ –4.49%):
∴ Price touched upper band after expansion;
∴ Volatility rising, room for extension;
∴ Midline ($~109.7K zone) = key support.
✴️ Conclusion: Bands = bullish expansion but risky near top edge.
⊢
▦ RSI (21, 9) – (60.74 / 55.97):
∴ RSI above 60 = bullish momentum intraday;
∴ Far from overbought;
∴ Momentum supportive.
✴️ Conclusion: RSI confirms bullish bias.
⊢
▦ MACD (9,21,9) – (Line 330.85 / Signal 323.29 / Histogram –7.57):
∴ Slight bearish histogram despite positive lines;
∴ Indicates deceleration of bullish momentum;
∴ Potential for short-term pullback.
✴️ Conclusion: MACD = cautionary divergence.
⊢
▦ Stoch RSI (3,3,21,9) – (K 33.33 / D 21.85):
∴ Rebounding from oversold zone;
∴ Early bullish reset;
∴ Supports continuation if price holds EMA21.
✴️ Conclusion: Stoch RSI = tactical rebound in progress.
⊢
🜎 Strategic Insight – Technical Oracle:
∴ The intraday chart reveals BTC pressing into a critical transition zone, where price action is sustained above EMA9 and EMA21, yet still confronting the weight of EMA50. This structure embodies the conflict between short-term bullish recovery and the inertia of a broader corrective slope;
∴ Bollinger dynamics expose price testing the upper band (~$111.2K), signaling volatility expansion. A close above this band would shift the volatility regime into a breakout posture, yet rejection here would reaffirm the band as containment, pulling Bitcoin back toward the midline ($109.7K);
▦ Momentum oscillators diverge:
∴ RSI at 60.74 projects strength, comfortably above neutrality, implying the market has regained bullish control intraday;
∴ MACD, however, whispers caution: line > signal, yet histogram negative (–7.57). This subtle divergence hints that while price moves upward, the underlying strength of momentum is waning;
∴ Stoch RSI curled upward from oversold (K 33.33 / D 21.85), supporting the probability of a rebound continuation, but only if supported by volume;
∴ Bitcoin stands at the mouth of decision. Supportive global indices and a softer dollar open the door for bulls, but internal momentum signals warn that strength may be brittle unless confirmed with follow-through above EMA50 and sustained beyond ($111.2K).
✴️ Conclusion and Interpretation: The intraday oracle portrays Bitcoin caught between external tailwinds (equities, dollar weakness) and internal hesitation (MACD divergence at resistance). If the structure clears ($111.2K) with conviction, upside extends toward ($112 / $113K). Failure to break transforms ($109.7K) into the next gravitational pull.
⊣
⨀ II. Cross-Market Overlay (H1):
▦ S&P500 Futures (SPX) – (+1.69%):
∴ Strong upward performance, reflecting clear risk-on appetite in equities;
∴ Reinforces the idea that investors are rotating back into risk assets, easing pressure on Bitcoin;
∴ Correlation intraday favors Bitcoin following the equity impulse.
✴️ Conclusion: SPX surge = supportive external catalyst for crypto upside.
⊢
▦ Dow Jones Futures (DJI) – (+1.68%):
∴ Similar bullish posture to SPX, confirming broad equity strength;
∴ Dow’s advance adds structural confirmation: this is not sectorial, but systemic risk-on;
∴ Provides BTC with secondary reinforcement, as both indices align.
✴️ Conclusion: DJI rally = synchronized support, amplifying bullish context.
⊢
▦ US Dollar Index (DXY) – (–0.09%):
∴ Dollar weakening slightly = reduced headwinds for risk assets;
∴ Historically, Bitcoin rallies when DXY softens;
∴ Though the drop is modest, it’s directionally supportive.
✴️ Conclusion: DXY negative = marginal tailwind for Bitcoin’s rebound.
⊢
🜎 Interpretation – Cross-Market Oracle:
∴ With equities (SPX, DJI) rising in tandem and the dollar easing, the macro-intraday environment leans pro-risk;
∴ Bitcoin finds aligned external conditions: equities provide momentum correlation, while the dollar’s decline removes friction;
∴ The confluence strengthens the probability of Bitcoin challenging resistance zones ($111.2K+), provided internal momentum validates the move.
✴️ Conclusion: Cross-markets stand as aligned tailwinds for Bitcoin intraday, granting bulls external reinforcement.
⊣
𓂀 Stoic-Structural Interpretation – Intraday (BTC/USD + Cross-Market, H1):
∴ Structure of Price: Bitcoin advances above EMA9/21, reclaiming short-term control, yet EMA50 remains a slope of resistance; Bollinger bands widen, showing volatility release; Upper band ($111.2K) acts as the gateway: breach signals expansion, rejection returns price toward ($109.7K) equilibrium;
∴ Momentum of Will: RSI (>60) projects renewed strength, Stoch RSI lifts from oversold as tactical breath, yet MACD histogram whispers restraint - momentum falters even as price climbs. The will of the market is not pure force, but effort against inertia;
∴ Flow of Capital: Equities (SPX +1.69%, DJI +1.68%) roar in risk-on alignment, while DXY (–0.09%) softens, easing friction. External streams pour favorable winds upon Bitcoin’s sail, yet the vessel must hold its structure or drift back to harbor.
✴️ Conclusion: Bitcoin intraday embodies the stoic lesson: external forces (equities up, dollar weak) favor advance, yet internal momentum is fragile. The outcome rests not in wish but in structure - resistance must yield for fate to shift.
⊢
· Cryptorvm Dominvs · MAGISTER ARCANVM · Vox Primordialis ·
· Dominivm Cardo Gyratio Omnivm · Silence precedes the next force. Structure is sacred ·
⊢
⟁ BTC/USD – BINANCE – (CHART: 1H) – (Sep 02, 2025).
◇ Analysis Price: $111,256.57.
⊣
⨀ I. Temporal Axis – Strategic Interval – (1H):
▦ EMA9 – (–2.78%):
∴ Price trading above EMA9 after recovery;
∴ Short-term bullish tilt, but EMA slope still negative;
∴ Needs sustained closes above to confirm momentum.
✴️ Conclusion: EMA9 = fragile bullish reclaim.
⊢
▦ EMA21 – (–3.06%):
∴ Mid-term intraday resistance;
∴ Price hovering above, but EMA slope negative;
∴ Confirms cautious recovery, not yet trend reversal.
✴️ Conclusion: EMA21 = tactical battleground.
⊢
▦ EMA50 – (–3.40%):
∴ Still trending lower;
∴ Acts as structural resistance in case of rejection;
∴ Price must conquer this line for sustainable recovery.
✴️ Conclusion: EMA50 = resistance wall.
⊢
▦ BB (21,2, basis = EMA9) – (Upper ~ –1.63% / Midline ~ –3.06% / Lower ~ –4.49%):
∴ Price touched upper band after expansion;
∴ Volatility rising, room for extension;
∴ Midline ($~109.7K zone) = key support.
✴️ Conclusion: Bands = bullish expansion but risky near top edge.
⊢
▦ RSI (21, 9) – (60.74 / 55.97):
∴ RSI above 60 = bullish momentum intraday;
∴ Far from overbought;
∴ Momentum supportive.
✴️ Conclusion: RSI confirms bullish bias.
⊢
▦ MACD (9,21,9) – (Line 330.85 / Signal 323.29 / Histogram –7.57):
∴ Slight bearish histogram despite positive lines;
∴ Indicates deceleration of bullish momentum;
∴ Potential for short-term pullback.
✴️ Conclusion: MACD = cautionary divergence.
⊢
▦ Stoch RSI (3,3,21,9) – (K 33.33 / D 21.85):
∴ Rebounding from oversold zone;
∴ Early bullish reset;
∴ Supports continuation if price holds EMA21.
✴️ Conclusion: Stoch RSI = tactical rebound in progress.
⊢
🜎 Strategic Insight – Technical Oracle:
∴ The intraday chart reveals BTC pressing into a critical transition zone, where price action is sustained above EMA9 and EMA21, yet still confronting the weight of EMA50. This structure embodies the conflict between short-term bullish recovery and the inertia of a broader corrective slope;
∴ Bollinger dynamics expose price testing the upper band (~$111.2K), signaling volatility expansion. A close above this band would shift the volatility regime into a breakout posture, yet rejection here would reaffirm the band as containment, pulling Bitcoin back toward the midline ($109.7K);
▦ Momentum oscillators diverge:
∴ RSI at 60.74 projects strength, comfortably above neutrality, implying the market has regained bullish control intraday;
∴ MACD, however, whispers caution: line > signal, yet histogram negative (–7.57). This subtle divergence hints that while price moves upward, the underlying strength of momentum is waning;
∴ Stoch RSI curled upward from oversold (K 33.33 / D 21.85), supporting the probability of a rebound continuation, but only if supported by volume;
∴ Bitcoin stands at the mouth of decision. Supportive global indices and a softer dollar open the door for bulls, but internal momentum signals warn that strength may be brittle unless confirmed with follow-through above EMA50 and sustained beyond ($111.2K).
✴️ Conclusion and Interpretation: The intraday oracle portrays Bitcoin caught between external tailwinds (equities, dollar weakness) and internal hesitation (MACD divergence at resistance). If the structure clears ($111.2K) with conviction, upside extends toward ($112 / $113K). Failure to break transforms ($109.7K) into the next gravitational pull.
⊣
⨀ II. Cross-Market Overlay (H1):
▦ S&P500 Futures (SPX) – (+1.69%):
∴ Strong upward performance, reflecting clear risk-on appetite in equities;
∴ Reinforces the idea that investors are rotating back into risk assets, easing pressure on Bitcoin;
∴ Correlation intraday favors Bitcoin following the equity impulse.
✴️ Conclusion: SPX surge = supportive external catalyst for crypto upside.
⊢
▦ Dow Jones Futures (DJI) – (+1.68%):
∴ Similar bullish posture to SPX, confirming broad equity strength;
∴ Dow’s advance adds structural confirmation: this is not sectorial, but systemic risk-on;
∴ Provides BTC with secondary reinforcement, as both indices align.
✴️ Conclusion: DJI rally = synchronized support, amplifying bullish context.
⊢
▦ US Dollar Index (DXY) – (–0.09%):
∴ Dollar weakening slightly = reduced headwinds for risk assets;
∴ Historically, Bitcoin rallies when DXY softens;
∴ Though the drop is modest, it’s directionally supportive.
✴️ Conclusion: DXY negative = marginal tailwind for Bitcoin’s rebound.
⊢
🜎 Interpretation – Cross-Market Oracle:
∴ With equities (SPX, DJI) rising in tandem and the dollar easing, the macro-intraday environment leans pro-risk;
∴ Bitcoin finds aligned external conditions: equities provide momentum correlation, while the dollar’s decline removes friction;
∴ The confluence strengthens the probability of Bitcoin challenging resistance zones ($111.2K+), provided internal momentum validates the move.
✴️ Conclusion: Cross-markets stand as aligned tailwinds for Bitcoin intraday, granting bulls external reinforcement.
⊣
𓂀 Stoic-Structural Interpretation – Intraday (BTC/USD + Cross-Market, H1):
∴ Structure of Price: Bitcoin advances above EMA9/21, reclaiming short-term control, yet EMA50 remains a slope of resistance; Bollinger bands widen, showing volatility release; Upper band ($111.2K) acts as the gateway: breach signals expansion, rejection returns price toward ($109.7K) equilibrium;
∴ Momentum of Will: RSI (>60) projects renewed strength, Stoch RSI lifts from oversold as tactical breath, yet MACD histogram whispers restraint - momentum falters even as price climbs. The will of the market is not pure force, but effort against inertia;
∴ Flow of Capital: Equities (SPX +1.69%, DJI +1.68%) roar in risk-on alignment, while DXY (–0.09%) softens, easing friction. External streams pour favorable winds upon Bitcoin’s sail, yet the vessel must hold its structure or drift back to harbor.
- Fatum – Destiny of Intraday: The path is compressed between structure and external tide:
- Break above $111.2K: opens the corridor to ($112 / $113K);
- Failure and rejection: gravity returns to ($109.7K / $109.3K) support cluster.
✴️ Conclusion: Bitcoin intraday embodies the stoic lesson: external forces (equities up, dollar weak) favor advance, yet internal momentum is fragile. The outcome rests not in wish but in structure - resistance must yield for fate to shift.
⊢
· Cryptorvm Dominvs · MAGISTER ARCANVM · Vox Primordialis ·
· Dominivm Cardo Gyratio Omnivm · Silence precedes the next force. Structure is sacred ·
⊢
Dagangan aktif
⊢BTC/USD + DJI + DXY + SP500 - (1H)
⊢
Dagangan ditutup: sasaran tercapai
⊣⟁ Bitcoin – Structural State Assessment - (Sep 02, 2025):
⨀ I. Intraday Axis - (1H):
▦ EMA9/21 reclaimed, RSI > 60, Stoch RSI rebounding.
∴ Short-term bullish recovery in play;
∴ Price capped by Bollinger upper band ($111.2K);
∴ MACD histogram remains negative -> momentum fragile.
✴️ Conclusion: Intraday = Neutral-Bullish (respiration phase).
⊢
⨀ II. Daily Axis - (1D):
▦ Price still rejected below EMA21/50 cluster;
▦ RSI fading under 50 neutrality;
▦ MACD firmly negative;
✴️ Conclusion: Daily = Bearish-Structural (trend intact).
⊢
⨀ III. Weekly Axis - (1W):
▦ EMA9 lost, EMA21 ($107.6K) as pivot;
▦ MACD weekly in bearish crossover;
▦ RSI > 50 but weakening;
✴️ Conclusion: Weekly = Bearish-Structural (risk dominates).
⊢
⨀ IV. On-Chain Layer - (MVRV + Inflows):
▦ MVRV Ratio = 2.05 -> profit-taking zone, mid-cycle correction bias;
▦ Exchange inflows remain calm -> no capitulation;
✴️ Conclusion: On-chain = Corrective, not Euphoric, not Capitulative.
⊢
🜎 Strategic Oracle – Multi-Layer Synthesis:
∴ Intraday resilience (Neutral-Bullish) clashes with higher timeframe weakness (Daily & Weekly Bearish);
∴ On-chain confirms mid-cycle distribution, not collapse;
∴ Market fate hinges on ($112 / $113K) breakout (neutralization) vs ($107K) -> breakdown (continuation to $103K).
✴️ Final Conclusion: Structure remains Bearish at macro scales, despite tactical intraday recovery. Only reclaim above ($113K) resets neutrality; loss of ($107K) delivers the bearish continuation.
⊢
Penerbitan berkaitan
Penafian
Maklumat dan penerbitan adalah tidak dimaksudkan untuk menjadi, dan tidak membentuk, nasihat untuk kewangan, pelaburan, perdagangan dan jenis-jenis lain atau cadangan yang dibekalkan atau disahkan oleh TradingView. Baca dengan lebih lanjut di Terma Penggunaan.
Penerbitan berkaitan
Penafian
Maklumat dan penerbitan adalah tidak dimaksudkan untuk menjadi, dan tidak membentuk, nasihat untuk kewangan, pelaburan, perdagangan dan jenis-jenis lain atau cadangan yang dibekalkan atau disahkan oleh TradingView. Baca dengan lebih lanjut di Terma Penggunaan.