Bitcoin and the Double Bottom Reversal Pattern: Is This a Key Turning Point?
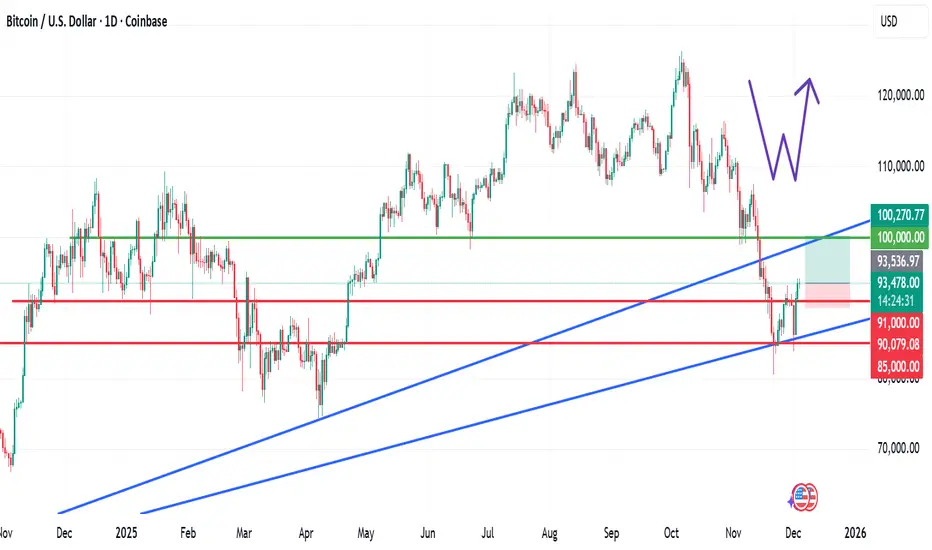
Following the previously outlined technical levels that played out successfully, Bitcoin has now formed a double bottom (W) reversal pattern, a widely recognised signal in technical analysis indicating potential bullish momentum.
Price action has also broken above the $91,000 level, which previously served as resistance and aligns with the neckline of the pattern.
A sustained hold above this zone may confirm the reversal structure and support further upside movement.
If the $91,000 support level remains intact, the next logical target based on pattern projection is the $100,000 zone and potentially beyond, depending on market sentiment and volume continuation.
Trade Plan
Entry 1: Current market price (aggressive positioning)
Entry 2: $92,000
Take Profit: $100,000 and above
Stop Loss: $89,900
Ensure your risk management remains balanced and aligned with your strategy.
If you found this analysis useful, feel free to like, share, and drop a comment below.
I am looking forward to engaging with you here on TradingView.
Penerbitan berkaitan
Penafian
Maklumat dan penerbitan adalah tidak bertujuan, dan tidak membentuk, nasihat atau cadangan kewangan, pelaburan, dagangan atau jenis lain yang diberikan atau disahkan oleh TradingView. Baca lebih dalam Terma Penggunaan.
Penerbitan berkaitan
Penafian
Maklumat dan penerbitan adalah tidak bertujuan, dan tidak membentuk, nasihat atau cadangan kewangan, pelaburan, dagangan atau jenis lain yang diberikan atau disahkan oleh TradingView. Baca lebih dalam Terma Penggunaan.