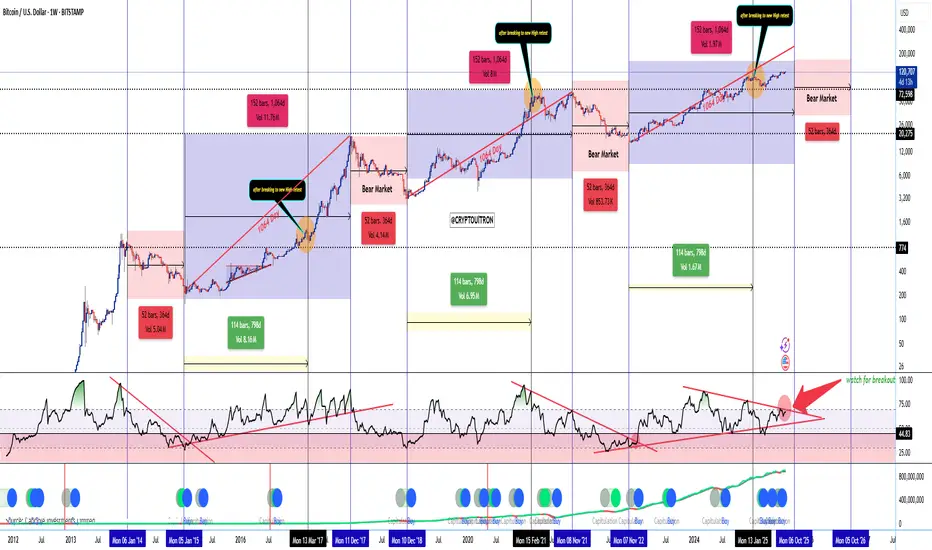
📊 BTC 1W Cycle Map — 1064-Day Cadence Intact
🎯 Top window: Week of 06 Oct ’25 (± 1–2 weeks)
🧩 Cycle structure (from chart):
📈 RSI setup:
🔍 Key chart signals:
📌 My read:
⏳ Post-top expectations:
~1 year of decline/mean reversion → likely retrace to prior breakout demand (mid-70s to low-80s).
Chart from 2023

🎯 Top window: Week of 06 Oct ’25 (± 1–2 weeks)
🧩 Cycle structure (from chart):
- 1064-day rhythm to macro top has played out in 2013, 2017, and 2021.
- From the Nov ’22 cycle low, the next 1064d lands on Oct ’25 → that’s my projected cycle top zone.
- Each cycle shows ATH break → retest → terminal leg before topping. Orange circles = retests. We’ve completed ours.
- Bear markets have been rhythmic: ~52 weeks / 364 bars of decline post-top. Marked in red for all past cycles.
📈 RSI setup:
- 1W RSI downtrend break has always preceded the final blow-off leg.
- Currently coiling just under that trendline (big red arrow). A confirmed breakout is my ignition trigger.
🔍 Key chart signals:
- Blue/green capitulation buy dots (hash ribbon + cycle models) historically cluster before major legs up, not at tops.
- Volume cycles also show ~114 weeks (798 days) of expansion phases between retest and top.
📌 My read:
- If RSI fails and price closes <95–100k weekly, I’ll treat it as an early-top scenario.
⏳ Post-top expectations:
~1 year of decline/mean reversion → likely retrace to prior breakout demand (mid-70s to low-80s).
Chart from 2023

Nota
📊 BTC Update — Post-Monthly Close (Oct 1)🔄 Since the Sept 20 update
• We said to expect chop/liquidity hunts between $113.3K–$116K with walls at $117.7K–$118.2K.
• We wicked down to $108.6K on Sept 22 (downside pools at 109/108 filled), then reclaimed back above $113.3K.
• September monthly closed ~$114K → macro breakout structure intact.
⸻
🧭 Where we are now (multi-TF read)
• Monthly: Green close at $114K; structure above 20MA band and prior ATH consolidation = healthy.
• Weekly: Price pressing the mid-band/EMA cluster. RSI mid-50s (no blow-off), MACD flat → consolidation, not breakdown.
• 3D / 1D: After the $108.6K sweep, EMAs curled up; daily RSI back ~50+ and attempting a momentum flip.
• 4H / 1H: Clear impulsive reclaim from the lows; 4H RSI > 50 and the down-trendline break is holding → room to probe $115.8K → $116.6K.
⸻
🗓 What to watch next
• This week (Sun close):
• ✅ Close > $115.5K → momentum recovery → targets $116.6K → $118.2K.
• 🟡 Inside $113.3K–$115.5K → continued chop / stop-hunts.
• ❌ Close < $113.3K → opens $111.5K, with risk of $109K retest.
• October path (base case):
• Bias = bullish consolidation while > $113.3K.
• Expect liquidity games between $115.8K–$118.2K before any clean break.
• Weekly close > $119.5K = breakout confirmation → $124.5K, then $132K+.
• Daily close < $113.3K = caution → $111K → $108.5K sweep risk.
⸻
🎯 Trade framing (scalp & spot)
• Scalp long idea: pullbacks into $113.5K–$114.0K with invalid < $113.3K, targets $115.8K / $116.6K, runner for $118.2K.
• Spot / swing: add only on weekly reclaim > $119.5K; invalidation weekly < $111K.
Nota
🔑 Key Levels you can play with 👇👇👇Supports
• $114.3K–$114.5K → intraday reclaim pivot (now).
• $113.3K–$113.5K → 🔑 defense (Fib/heatmap shelf).
• $112.0K–$112.3K → daily mid-band/EMA support.
• $111.3K–$111.5K → next liquidity shelf.
• $108.5K–$109.0K → swept zone; loses this = $107K test.
• $107.0K–$107.5K → macro swing low / invalidation of the current leg.
• $104–$105K → ABC extension target if $107K fails.
Resistances
• $115.8K–$116.1K → first magnet (heatmap + EMAs).
• $116.6K–$116.8K → wall #2.
• $117.7K–$118.2K → main rejection cluster (0.702 + liquidity).
• $119.5K–$120.0K → weekly breakout trigger.
• $123.7K–$124.5K → macro range high; above here = path toward Fib 1.618+.
Nota
🧠 Cycle + Macro Context• We’re at ~Day 1050 from the Nov ’22 bottom. In 2017 & 2021 the cycle tops printed ~Day 1064.
• Conclusion: the time window for a macro top is OPEN, but structure says “not yet”:
• 2W RSI is compressing in a triangle <75 (prior tops were RSI > 90).
• No Pi Cycle Top and 1.618–1.702 Fib (173K–196K) still untagged.
• Rate-cut context (chart marks):
• Sept 18, 2024 FOMC pause/hint preceded BTC’s big reclaim.
• Sept 17, 2025 first cut (per chart annotation) = liquidity tailwind. BTC often front-runs → supports a final leg before the true cycle peak.
✅ Final Read
• Time says the top window is open (1050 → 1064 days),
• Structure says final leg not printed (RSI not blown off; key Fibs unhit).
• As long as $113.3K holds, treat October as final consolidation before the run at $118K → $120K → $124.5K.
• Lose $113.3K and especially $111K → expect another $109K / $108.5K liquidity sweep.
Penafian
Maklumat dan penerbitan adalah tidak dimaksudkan untuk menjadi, dan tidak membentuk, nasihat untuk kewangan, pelaburan, perdagangan dan jenis-jenis lain atau cadangan yang dibekalkan atau disahkan oleh TradingView. Baca dengan lebih lanjut di Terma Penggunaan.
Penafian
Maklumat dan penerbitan adalah tidak dimaksudkan untuk menjadi, dan tidak membentuk, nasihat untuk kewangan, pelaburan, perdagangan dan jenis-jenis lain atau cadangan yang dibekalkan atau disahkan oleh TradingView. Baca dengan lebih lanjut di Terma Penggunaan.


