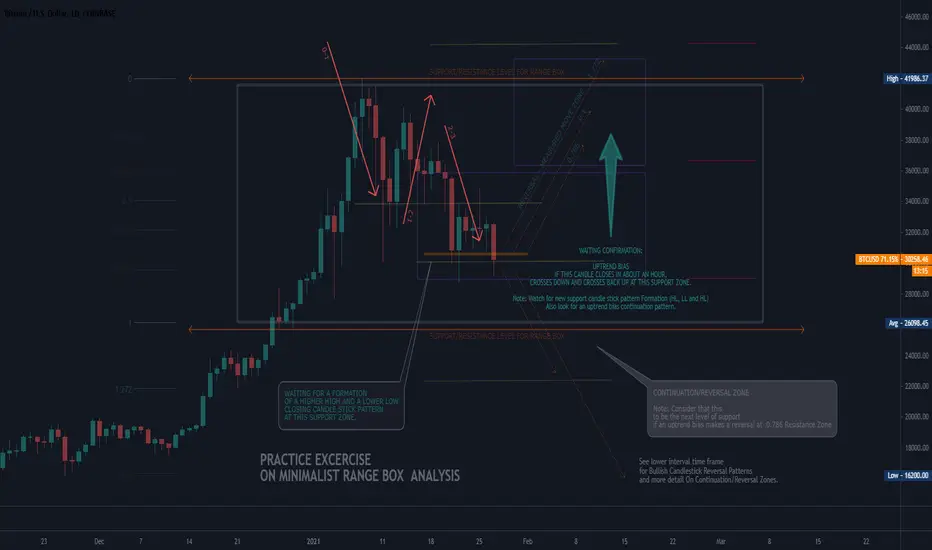
(DAILY INTERVAL CHART)
This is my practice exercise for my homework for a minimalist approach to chart analysis (No INDICATORS).
Using Range Boxes as Zones of interest, especially the tops and bottoms of it.
A Reversal (Double Bottom) is likely to happen if it forms new support candle stick pattern within the small box bottom in a couple of hours.
If not, look for a continuation pattern for a down trend bias towards the previous lowest support zone.
Note: This is not a financial advice. Your capital maybe at risk.
I am a beginner who is learning how to trade using paper trading to see the results of my daily analysis exercises.
Penafian
Maklumat dan penerbitan adalah tidak dimaksudkan untuk menjadi, dan tidak membentuk, nasihat untuk kewangan, pelaburan, perdagangan dan jenis-jenis lain atau cadangan yang dibekalkan atau disahkan oleh TradingView. Baca dengan lebih lanjut di Terma Penggunaan.
Penafian
Maklumat dan penerbitan adalah tidak dimaksudkan untuk menjadi, dan tidak membentuk, nasihat untuk kewangan, pelaburan, perdagangan dan jenis-jenis lain atau cadangan yang dibekalkan atau disahkan oleh TradingView. Baca dengan lebih lanjut di Terma Penggunaan.
