⊣
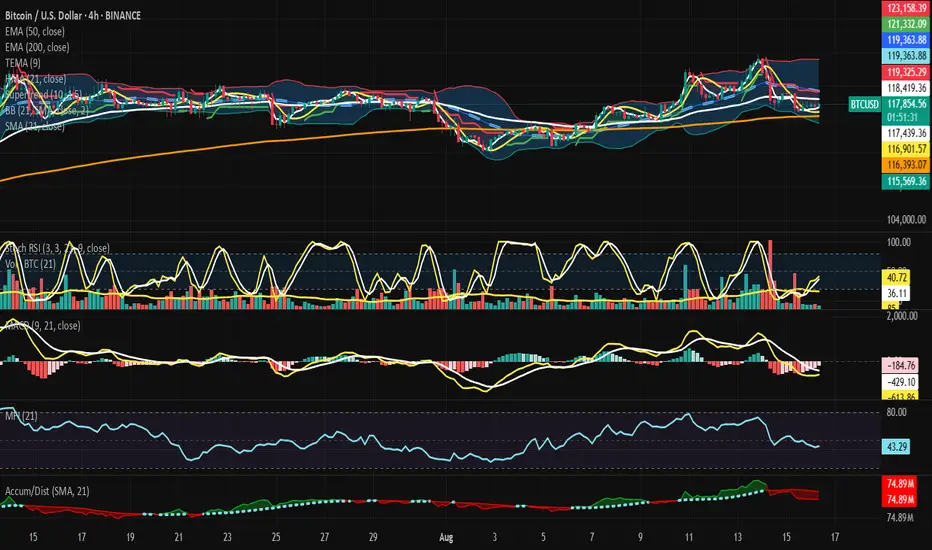
⟁ BTC/USD - BINANCE - (CHART: H4) - (Aug 16, 2025).
◇ Analysis Price: $118,020.60.
⊣
⨀ I. Temporal Axis - Strategic Interval - (H4):
▦ EMA50 - $118,425.87:
∴ The EMA50 is currently positioned slightly above the active trading price - ($118,020.60), establishing a localized resistance zone, showing that the market is struggling to sustain momentum above this median dynamic level;
∴ In recent sessions, price action fluctuated around EMA50, but failed to reclaim it as stable support, indicating weakness in short-term recovery attempts;
∴ The slope of EMA50 remains almost flat, not strongly ascending, suggesting market indecision and lack of directional strength.
✴️ Conclusion: EMA50 is a resistance barrier, neutral-to-bearish unless reclaimed decisively.
⊢
▦ EMA200 - $116,394.72:
∴ The EMA200, being a long-term stability reference, is below the current market price, acting as structural support for the mid-term;
∴ The wide gap between EMA200 and EMA50 indicates a neutral compression phase — price oscillating between medium and long horizons;
∴ If the market falls back toward EMA200, buyers may attempt defense; a breach would confirm broader weakness in market structure.
✴️ Conclusion: EMA200 is a strong support anchor, still intact, but tested boundaries are plausible.
⊢
▦ TEMA9 - $117,520.39:
∴ TEMA9 is below the current price, serving as immediate dynamic support, often used by short-term traders;
∴ Market bounces in the last sessions respected this fast-moving indicator, giving temporary confidence to bulls;
∴ However, repeated retests weaken its authority, showing fragility in momentum if volume does not sustain.
✴️ Conclusion: TEMA9 is immediate support, fragile, requiring reinforcement by volume.
⊢
▦ HMA21 - $116,919.69:
∴ The HMA21 lies under market value, acting as secondary support, confirming alignment with EMA200 as part of the supportive axis;
∴ Its curve is slightly ascending, signaling a faint bullish rebound in the short horizon;
∴ Alignment below price confirms resilience but also dependency - if price collapses, this level could break swiftly.
✴️ Conclusion: HMA21 is secondary support, dynamic yet vulnerable to volatility.
⊢
▦ SMA21 - $119,371.78:
∴ SMA21 sits above current price, working as resistance, in opposition to the supports listed (HMA21/TEMA9);
∴ This creates a compression corridor: TEMA9 + HMA21 (support) vs SMA21 (resistance);
∴ Market structure indicates stagnation inside a tight channel, waiting for breakout or breakdown.
✴️ Conclusion: SMA21 is resistance, framing the price in a boxed range.
⊢
▦ SuperTrend (10, 1.5) - $119,325.29:
∴ The SuperTrend remains above the actual price, signaling a bearish bias;
∴ Market action is still below its trigger, rejecting short-term bullish confirmation;
∴ Only a sustained breakout above this level could alter the bearish sentiment.
✴️ Conclusion: SuperTrend = Bearish stance remains active.
⊢
▦ BB (21, 2) - Upper: $123,154.36 / Basis: $119,371.78 / Lower: $115,589.21:
∴ Price is compressed between the midline (basis) and lower band, showing weakness;
∴ Recent volatility spikes touched the upper band but were rejected, confirming lack of strength;
∴ The narrowing of bands signals imminent expansion - market preparing for stronger volatility move.
✴️ Conclusion: Bollinger = Compression near lower range, potential breakout ahead.
⊢
▦ StochRSI (3, 3, 21, 9) - K: 44.11 / D: 37.23:
∴ Both K and D lines are mid-range, neither oversold nor overbought, reflecting indecision;
∴ The slight upward crossing indicates a possible rebound attempt, but weak until confirmed by momentum;
∴ Position in neutral zone diminishes conviction - signal could reverse quickly.
✴️ Conclusion: StochRSI suggests fragile recovery, neutral-to-bullish bias.
⊢
▦ Volume (21) - 9 / 85:
∴ Current volume is extremely weak compared to the SMA21, showing low conviction;
∴ This volume drought reduces the probability of sustainable breakouts;
∴ Whales or institutions are not actively engaged at this moment.
✴️ Conclusion: Volume shows lack of strength; market drifting without strong participation.
⊢
▦ MACD (9, 21, 9) - MACD: -170.26 / Signal: -425.48 / Histogram: -595.74:
∴ MACD remains negative, showing bearish underlying pressure;
∴ Histogram is contracting, indicating that bearish momentum is slowing down, but not reversed;
∴ A bullish crossover is still distant, weakening bullish recovery chances in near term.
✴️ Conclusion: MACD = Bearish pressure moderating, no reversal confirmed yet.
⊢
▦ RSI (21, 9) - 43.19:
∴ RSI is below 50, confirming bearish bias;
∴ Position not yet oversold, showing market retains room for further downside;
∴ The flat slope reflects indecision - neither strong selling panic nor buying force.
✴️ Conclusion: RSI = Bearish-neutral, momentum still under equilibrium.
⊢
▦ MFI (21) - 43.19:
∴ MFI mirrors RSI levels, confirming lack of strong inflow or outflow;
∴ Volume-weighted money flow confirms market neutrality, slightly leaning bearish;
∴ No divergence spotted to suggest imminent reversal.
✴️ Conclusion: MFI = Neutral, aligned with RSI weakness.
⊢
▦ OBV (21) - 74.89M:
∴ OBV is flat, not rising in accordance with recent small price upticks, showing lack of buyer confirmation;
∴ Absence of strong accumulation suggests price is rising on weak grounds;
∴ If OBV fails to climb, rallies will likely fail at resistance points.
✴️ Conclusion: OBV confirms weak demand, neutral-bearish stance.
⊢
🜎 Strategic Insight - Technical Oracle:
∴ The H4 structure reveals a compressed battlefield: dynamic supports (TEMA9, HMA21, EMA200) try to sustain price above $116K–117K, while layered resistances (EMA50, SMA21, SuperTrend, BB basis) weigh down overhead near $118K–119K;
∴ Volume collapse and flat OBV expose the fragility of bullish attempts, showing lack of participation. RSI and MFI align at ~43, signaling neutrality with bearish tilt. MACD remains negative, albeit moderating, hinting bearish exhaustion rather than reversal;
∴ Thus, BTC/USD stands in tense equilibrium: support corridor anchored near $116K, resistance dome at $119K;
∴ Market awaits volatility ignition, and the Bollinger Band squeeze warns a breakout is imminent;
∴ Without volume, upward attempts risk collapse; with momentum reactivation, resistance layers may fracture.
⊢
𓂀 Stoic-Structural Interpretation:
∴ The chart reveals not strength, but suspension - Bitcoin hovers between its moving average guardians, caught within corridors of compression where price neither collapses nor ascends with conviction;
∴ EMA50 denies passage above, while EMA200 anchors from below - structure is preserved not by will, but by inertia;
∴ Indicators whisper the same tale: RSI and MFI linger at 43, momentum without fire, money without decisive flow;
∴ MACD stays in the shadows, still negative, showing the bear’s hand loosening but not releasing;
∴ OBV remains flat, silence of accumulation, a desert where no buyer’s army marches;
∴ Bollinger Bands coil tighter, warning of the coming storm - when silence stretches, force prepares.
✴️ Stoic Arcane Conclusion: The market does not yield to hope nor despair, it waits - stillness before expansion. To the disciplined observer, this is not chaos, but structure: a narrowing gate where patience is the true weapon.
⊢
✦ Structure:
∴ The H4 battlefield is confined within a narrow dominion - ($116,000 to $119,500) - where supports (TEMA9, HMA21, EMA200) forge the lower bulwark, and resistances (EMA50, SMA21, SuperTrend, BB Basis) construct the ceiling;
∴ Momentum oscillators (RSI, MFI, StochRSI) hover in neutrality, neither signaling exhaustion nor ignition, mirroring the market’s stoic posture;
∴ MACD remains submerged in negative territory, its histogram contracting, a sign of fading bearish strength but absent bullish conquest;
∴ Volume and OBV betray the truth: demand is hollow, accumulation is absent, and rallies lack the blood of conviction;
∴ Bollinger compression seals the chamber, a tightening coil foretelling release - structure bends, not breaks, awaiting its destined expansion.
✴️ Structural Seal: The architecture is one of suspended energy, a locked formation where silence is not weakness, but the breath before eruption.
⊢
· Cryptorvm Dominvs · MAGISTER ARCANVM · Vox Primordialis ·
· Dominivm Cardo Gyratio Omnivm · Silence precedes the next force. Structure is sacred ·
⊢
Dagangan aktif
⊢Bitcoin - Axis of Return and Expansion, The Path of Compression to Breakout.
⊢
⟁ BTC/USD - BINANCE - (CHART: H4) - (Aug 16, 2025).
⟴
⊢
⨀ Fibonacci Dual Axis – Retracement & Extension - (H4):
▦ Fibonacci Retracement – Axis of Return:
∴ 0.382 - ($119,200): Aligns with SMA21 and mid-BB, confirming a resistance ceiling;
∴ 0.500 - ($119,371): Forms the median wall of structure - equilibrium zone between bullish and bearish dominion;
∴ 0.618 - ($116,463): Coincides with EMA200/HMA21 support cluster, serving as the sacred floor of correction;
✴️ Conclusion: Retracement confirms compression corridor ($116.4K / $119.3K).
⊢
▦ Fibonacci Extension – Axis of Projection:
∴ 0.618 - ($122,720): Is the first expansion gate above resistance, testing bulls’ conviction;
∴ 0.786 - ($125,706): Becomes the tactical checkpoint, where prior sellers may regroup;
∴ 1.000 - ($128,223): Is full projection of the prior impulse mirrored upward, potential psychological barrier;
∴ 1.618 - ($135,000 / 136,000): Stands as golden extension - the ultimate zenith of bullish destiny.
✴️ Conclusion: Extension unlocks projection corridor ($122.7K / $136K), conditional upon breakout above ($119.3K).
⊢
🜎 Strategic Insight – Fibonacci Dual Oracle:
∴ Retracement defined the corridor of return, binding Bitcoin between ($116.4K) - support and ($119.3K) - resistance;
∴ Extension unveils the corridor of projection, mapping bullish destiny from ($122.7K) through ($136K);
▦ Together they form the Dual Axis of Structure:
∴ Failure below ($116.4K) -> collapse back to ($111K);
∴ Break above ($119.3K) -> ignition toward ($122.7K, $125.7K, $128.2K), and finally ($135K).
𓂀 The market stands still - yet silence here is not emptiness, but preparation. The structure bends under compression, waiting to release force into expansion.
⊢
· Cryptorvm Dominvs · MAGISTER ARCANVM · Vox Primordialis ·
· Dominivm Cardo Gyratio Omnivm ·
⚚ · Silence precedes the next force. Structure is sacred · ⚚
⊢
Penerbitan berkaitan
Penafian
Maklumat dan penerbitan adalah tidak bertujuan, dan tidak membentuk, nasihat atau cadangan kewangan, pelaburan, dagangan atau jenis lain yang diberikan atau disahkan oleh TradingView. Baca lebih dalam Terma Penggunaan.
Penerbitan berkaitan
Penafian
Maklumat dan penerbitan adalah tidak bertujuan, dan tidak membentuk, nasihat atau cadangan kewangan, pelaburan, dagangan atau jenis lain yang diberikan atau disahkan oleh TradingView. Baca lebih dalam Terma Penggunaan.