Technical Analysis and Outlook:
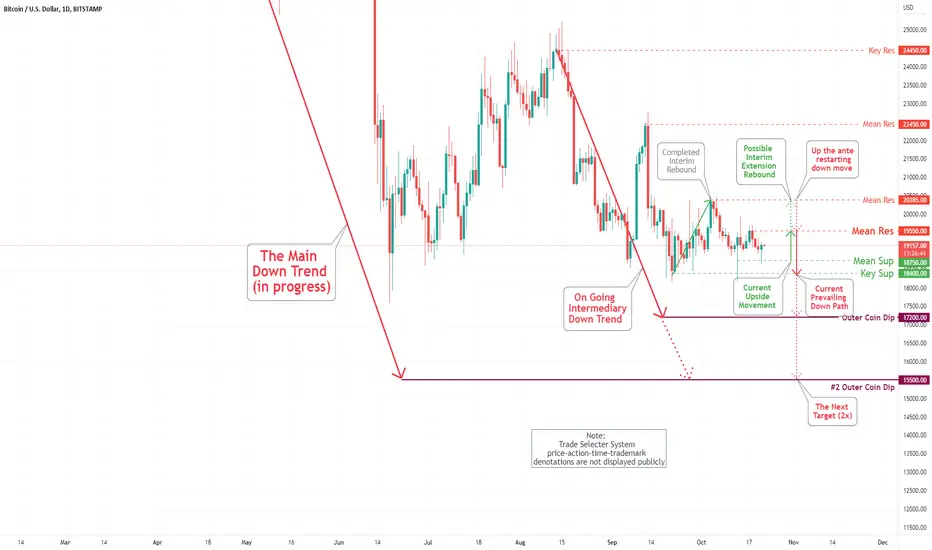
The Bitcoin is churning between our Mean Res $19,550 and Mean Sup $18,750. As specified on the Bitcoin (BTC/USD) Daily Chart Analysis For October 14, the possibility of moving to the Outer Coin Dip of $17,200 and extending the overall outcome to the #2 Outer Coin Dip at $15,500 is in the process. Reaching out in the short-term to the Mean Res $19,550 and possibly Mean Res $20,385 is blowing hot and cold.
The Bitcoin is churning between our Mean Res $19,550 and Mean Sup $18,750. As specified on the Bitcoin (BTC/USD) Daily Chart Analysis For October 14, the possibility of moving to the Outer Coin Dip of $17,200 and extending the overall outcome to the #2 Outer Coin Dip at $15,500 is in the process. Reaching out in the short-term to the Mean Res $19,550 and possibly Mean Res $20,385 is blowing hot and cold.
Penafian
Maklumat dan penerbitan adalah tidak bertujuan, dan tidak membentuk, nasihat atau cadangan kewangan, pelaburan, dagangan atau jenis lain yang diberikan atau disahkan oleh TradingView. Baca lebih dalam Terma Penggunaan.
Penafian
Maklumat dan penerbitan adalah tidak bertujuan, dan tidak membentuk, nasihat atau cadangan kewangan, pelaburan, dagangan atau jenis lain yang diberikan atau disahkan oleh TradingView. Baca lebih dalam Terma Penggunaan.