⊢
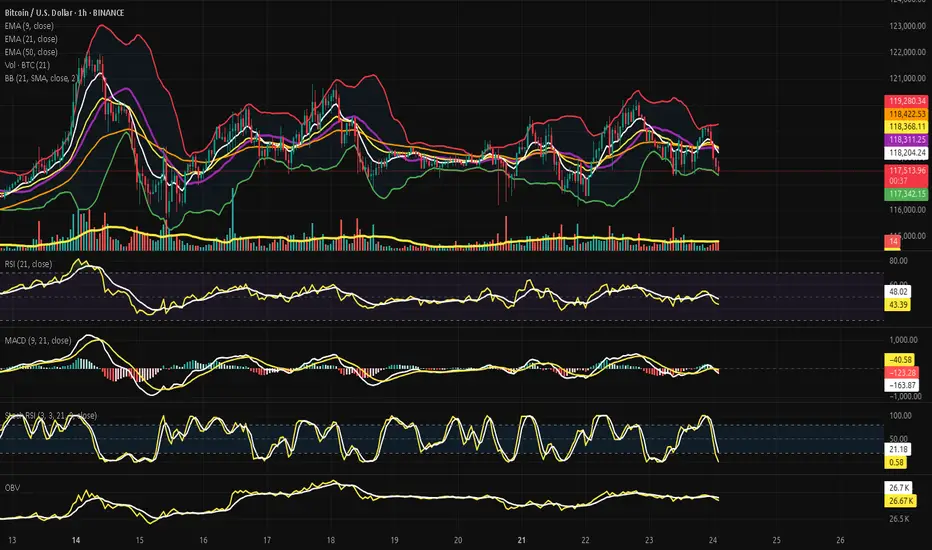
⟁ BTC/USD - BINANCE - (CHART: 1H) - (July 24, 2025).
◇ Analysis Price: $117.830,17.
⊣
⨀ I. Temporal Axis - Strategic Interval - (1H):
▦ EMA9 - ($118.267,48):
∴ The 9-period Exponential Moving Average (EMA9) was serving as immediate microstructural support until July 23rd, when a full-bodied bearish candle broke through it with volume below average but directionally firm;
∴ Post-break, EMA9 began to flatten, then bend downward, reflecting a tactical loss of bullish momentum within the intraday range structure;
∴ Price has attempted multiple recoveries toward EMA9 but has been consistently rejected at or below it, confirming its transition into resistance status.
✴️ Conclusion: EMA9 has transitioned from a dynamic support to tactical resistance, indicating a short-term trend deterioration and weakening of upward initiative.
⊢
▦ EMA21 - ($118.396,85):
∴ The 21-period EMA functions as the median layer of microstructure and has held relatively flat for several days, suggesting a compressed momentum environment;
∴ As of the latest price action, the EMA9 has definitively crossed below EMA21 - a classic tactical signal of microtrend exhaustion, especially when paired with lateral volume and a suppressed RSI;
∴ EMA21 remains unbroken since July 21st, reinforcing its role as an anchor level for short-term rejections and as a ceiling against breakout attempts.
✴️ Conclusion: EMA21 maintains structural weight as resistance, and the confirmed cross-under by EMA9 introduces a tactical shift into intraday bearish flow.
⊢
▦ EMA50 - ($118.434,93):
∴ The 50-period EMA, long considered the “defensive perimeter” of bullish short-term structure, had been flattening with slight upward bias since July 19th;
∴ However, in the last two sessions, it has shown the first measurable downward curvature, marking the decay of medium-term intraday bullish control;
∴ Price remains significantly below the EMA50, and multiple upside attempts have failed before even reaching it, reflecting market hesitation and lack of participation.
✴️ Conclusion: EMA50 has begun its first bearish slope since July 16th, indicating an eroded tactical bias and confirming loss of momentum from the bulls' side.
⊢
▦ Bollinger Bands (21, 2) - (Upper: $119.254,34 / Lower: $117.398,28):
∴ The Bollinger Bands have narrowed continuously over the last three sessions, forming a visible compression channel - a prelude to volatility expansion;
∴ Price rejected cleanly from the upper band on July 23rd and traveled to the lower band without support, closing two candles consecutively near the lower range;
∴ The Bollinger Median is aligned with the EMA21, reinforcing its status as the core compression axis and tactical gravity point.
✴️ Conclusion: Bollinger structure suggests imminent breakout scenario; current price behavior signals bearish volatility bias unless structure is broken with strong volume.
⊢
▦ Volume + EMA 21 - (Current: 13 BTC):
∴ Volume has declined steadily throughout the last five trading sessions, as seen in the downward-sloping EMA21 overlaid on the volume histogram;
∴ Recent bearish moves occurred on lower volume compared to previous weeks, indicating low conviction and possible manipulation-prone liquidity zones;
∴ There is no expansion in volume accompanying the most recent directional candles, confirming this as a phase of tactical disinterest rather than distribution.
✴️ Conclusion: Market participants are not committing capital - the tape is flat, silent, and manipulable, increasing the risk of abrupt fakeouts or shadow breakouts.
⊢
▦ RSI (21) + EMA 9 - (Current RSI: 45.55):
∴ The Relative Strength Index has remained below the 50-neutral mark for three sessions, with a confirmed downward slope and rejection from its 9-period EMA overlay;
∴ There is no sign of divergence, bullish or bearish, suggesting that price action is neither exhausted nor ready to reverse;
∴ RSI’s current position confirms momentum is negative but controlled - an environment of inertia rather than acceleration.
✴️ Conclusion: RSI confirms tactical weakness - directional force is absent, and momentum favors sellers in a low-intensity regime.
⊢
▦ Stochastic RSI (3, 3, 21, 9) - (Current: 4.32):
∴ The Stoch RSI has fallen into extreme oversold territory after failing to sustain a double-top formation near the 80-level earlier this week;
∴ The plunge occurred with speed and depth, signaling loss of buying initiative - often a precursor to passive rebounds without follow-through;
∴ Current readings near zero indicate the potential for technical retracement, but no reversal confirmation is present without RSI and MACD alignment.
✴️ Conclusion: The oscillator signals oversold status, but the context suggests any bounce would be corrective, not impulsive - a trap for premature long entries.
⊢
▦ MACD (9, 21) - (MACD: -95.69 / Signal: -129.37):
∴ MACD histogram shows initial contraction of bearish momentum, but remains submerged below the zero-line and far from a clean crossover;
∴ MACD line is attempting to turn up, but the signal line remains significantly below it, indicating lack of consensus between short and medium-term momentum;
∴ Previous fake signals from MACD in this range suggest caution divergence is visible, but -structure is weak.
✴️ Conclusion: MACD shows early signs of momentum divergence, but without structure or volume, the setup remains fragile and unconfirmed.
⊢
▦ OBV + EMA9 - (OBV: 26.69K):
∴ On-Balance Volume has entered a horizontal band with no structural incline or decline for three consecutive days;
∴ OBV's 9-period EMA is now perfectly flat, reflecting market indecision and a symmetrical distribution of volume over time;
∴ No bullish or bearish divergence is visible, indicating that volume flow is passive and non-directional.
✴️ Conclusion: OBV confirms tactical silence in the order book - structure lacks engagement, and accumulation or distribution is absent.
⊢
🜎 Strategic Insight - Technical Oracle:
∴ All indicators on the H1 chart converge toward a single message: tactical drift within a structurally neutral, low-volume regime;
∴ The EMA's are aligned downward, RSI is slipping without exhaustion, MACD offers unconfirmed divergence, and Stoch RSI is oversold without structure;
∴ This constellation presents a dangerous battlefield - one where silence reigns louder than signal;
∴ Breakouts are possible, but not probable without macro ignition.
⊢
∫ II. On-Chain Intelligence - (Source: CryptoQuant):
▦ Exchange Reserves + 9EMA - (All Exchanges):
∴ Bitcoin reserves on centralized exchanges have decreased from (~2.46M) to 2.41M Bitcoin over the past 30 days, but the decline halted on July 21st and entered a horizontal range;
∴ This plateau indicates a pause in the long-term outflow trend, suggesting that neither accumulation nor distribution is dominating;
∴ Exchange reserves are a key liquidity gauge, and flatlining implies equilibrium between withdrawal behavior and deposit pressure.
✴️ Conclusion: No liquidity threat from centralized exchange reserves - a neutral signal in an inert market.
⊢
▦ Funding Rate + 9EMA - (All Exchanges):
∴ The funding rate remains mildly positive across perpetual contracts, indicating a slight long bias - (+0.008);
∴ However, the rate is far from extremes that would signify either overleveraging or liquidation risk;
∴ Historical context shows that a funding rate near zero during price stagnation often precedes volatility expansion.
✴️ Conclusion: Cautious optimism present among derivatives traders, but not enough to drive trend - latent energy, directionless.
⊢
▦ Stablecoin Ratio + 9EMA - (All Exchanges):
∴ The ratio of stablecoins to Bitcoin on exchanges remains at all-time lows, signaling an environment with reduced buying power;
∴ This lack of fresh capital severely limits the capacity for breakout rallies, especially when combined with poor volume and flat OBV;
∴ No stablecoin inflows = no fuel for upward movement.
✴️ Conclusion: The market is liquidity-starved - stablecoin ratio confirms lack of bullish firepower.
⊢
▦ Realized Cap + 9EMA:
∴ Realized Cap has surpassed the $1 trillion mark for the first time, suggesting robust conviction among holders and long-term participants;
∴ This metric rises only when coins move at a profit, indicating that active participants are not capitulating but rather holding or consolidating;
∴ The Realized Cap trajectory diverges from flat spot price - an arcane sign of underlying strength.
✴️ Conclusion: Structural confidence remains intact at the macro level - price inertia belies silent conviction.
⊢
🜎 Strategic Insight - On-Chain Oracle:
∴ On-chain metrics whisper stability;
∴ No excessive optimism, no panic, just a dry and frozen battlefield;
∴ Exchange reserves are flat, stablecoin ratio is weak, but Realized Cap shows unwavering belief; ∴ If the market breaks, it will be macro-induced - not on-chain triggered.
⊢
✴️ Codicillus Silentii - Strategic Note:
∴ The gatekeepers are at the threshold:
∴ Both are macro-keystones that will either ignite movement or deepen compression. The tape is silent because the world awaits signal.
⊢
𓂀 Stoic-Structural Interpretation:
▦ Structurally Neutral - Tactically Bearish Drift.
∴ EMA's aligned downward, RSI below midline, OBV stagnant - no strength, no collapse;
∴ Bearish drift, but no conviction.
▦ Tactical Range Caution:
∴ Support: $117.400 - (lower Bollinger limit);
∴ Resistance: $118.900 - (EMA cluster + BB midline).
✴️ Final Seal: Bitcoin rests under the veil of compression. Eyes turn to Powell. Silence prepares the break.
⊢
✴️ Final Codex Interpretation:
∴ The chart speaks not in fire nor fury - but in breathless tension:
Each line, curved and silent, awaits the tremor of a greater voice;
The market is not weak - it is listening. And what it hears may not be price, but power.
∴ The candles drift beneath their own gravity:
The EMA's now form a declining constellation, dimming the tactical skies;
No reversal, no collapse - only weightless time.
∴ Volume is not a storm. It is absence:
And absence in markets is not peace - it is preparation.
∴ On-chain, conviction stands with sealed lips:
Reserves unmoved, stablecoins withdrawn, but Realized Cap ascends - as if the soul of Bitcoin advances, while the flesh waits behind.
∴ And above all - the macro sphere:
Two seals remain locked: Powell’s speech and GDP;
One whispers interest rates. The other shouts reality.
⊢
⊢
✴️ Conclusion Codex Interpretation:
∴ Bitcoin is in deliberate suspension - structurally stoic, tactically inert;
∴ A sovereign asset waiting not for buyers, but for context;
∴ The gate opens July 25th. Until then: silence reigns.
⊢
⧉
· Cryptorvm Dominvs · MAGISTER ARCANVM · Vox Primordialis ·
⚜️ ⌬ - Silence precedes the next force. Structure is sacred - ⌬ ⚜️
⧉
⊢
⟁ BTC/USD - BINANCE - (CHART: 1H) - (July 24, 2025).
◇ Analysis Price: $117.830,17.
⊣
⨀ I. Temporal Axis - Strategic Interval - (1H):
▦ EMA9 - ($118.267,48):
∴ The 9-period Exponential Moving Average (EMA9) was serving as immediate microstructural support until July 23rd, when a full-bodied bearish candle broke through it with volume below average but directionally firm;
∴ Post-break, EMA9 began to flatten, then bend downward, reflecting a tactical loss of bullish momentum within the intraday range structure;
∴ Price has attempted multiple recoveries toward EMA9 but has been consistently rejected at or below it, confirming its transition into resistance status.
✴️ Conclusion: EMA9 has transitioned from a dynamic support to tactical resistance, indicating a short-term trend deterioration and weakening of upward initiative.
⊢
▦ EMA21 - ($118.396,85):
∴ The 21-period EMA functions as the median layer of microstructure and has held relatively flat for several days, suggesting a compressed momentum environment;
∴ As of the latest price action, the EMA9 has definitively crossed below EMA21 - a classic tactical signal of microtrend exhaustion, especially when paired with lateral volume and a suppressed RSI;
∴ EMA21 remains unbroken since July 21st, reinforcing its role as an anchor level for short-term rejections and as a ceiling against breakout attempts.
✴️ Conclusion: EMA21 maintains structural weight as resistance, and the confirmed cross-under by EMA9 introduces a tactical shift into intraday bearish flow.
⊢
▦ EMA50 - ($118.434,93):
∴ The 50-period EMA, long considered the “defensive perimeter” of bullish short-term structure, had been flattening with slight upward bias since July 19th;
∴ However, in the last two sessions, it has shown the first measurable downward curvature, marking the decay of medium-term intraday bullish control;
∴ Price remains significantly below the EMA50, and multiple upside attempts have failed before even reaching it, reflecting market hesitation and lack of participation.
✴️ Conclusion: EMA50 has begun its first bearish slope since July 16th, indicating an eroded tactical bias and confirming loss of momentum from the bulls' side.
⊢
▦ Bollinger Bands (21, 2) - (Upper: $119.254,34 / Lower: $117.398,28):
∴ The Bollinger Bands have narrowed continuously over the last three sessions, forming a visible compression channel - a prelude to volatility expansion;
∴ Price rejected cleanly from the upper band on July 23rd and traveled to the lower band without support, closing two candles consecutively near the lower range;
∴ The Bollinger Median is aligned with the EMA21, reinforcing its status as the core compression axis and tactical gravity point.
✴️ Conclusion: Bollinger structure suggests imminent breakout scenario; current price behavior signals bearish volatility bias unless structure is broken with strong volume.
⊢
▦ Volume + EMA 21 - (Current: 13 BTC):
∴ Volume has declined steadily throughout the last five trading sessions, as seen in the downward-sloping EMA21 overlaid on the volume histogram;
∴ Recent bearish moves occurred on lower volume compared to previous weeks, indicating low conviction and possible manipulation-prone liquidity zones;
∴ There is no expansion in volume accompanying the most recent directional candles, confirming this as a phase of tactical disinterest rather than distribution.
✴️ Conclusion: Market participants are not committing capital - the tape is flat, silent, and manipulable, increasing the risk of abrupt fakeouts or shadow breakouts.
⊢
▦ RSI (21) + EMA 9 - (Current RSI: 45.55):
∴ The Relative Strength Index has remained below the 50-neutral mark for three sessions, with a confirmed downward slope and rejection from its 9-period EMA overlay;
∴ There is no sign of divergence, bullish or bearish, suggesting that price action is neither exhausted nor ready to reverse;
∴ RSI’s current position confirms momentum is negative but controlled - an environment of inertia rather than acceleration.
✴️ Conclusion: RSI confirms tactical weakness - directional force is absent, and momentum favors sellers in a low-intensity regime.
⊢
▦ Stochastic RSI (3, 3, 21, 9) - (Current: 4.32):
∴ The Stoch RSI has fallen into extreme oversold territory after failing to sustain a double-top formation near the 80-level earlier this week;
∴ The plunge occurred with speed and depth, signaling loss of buying initiative - often a precursor to passive rebounds without follow-through;
∴ Current readings near zero indicate the potential for technical retracement, but no reversal confirmation is present without RSI and MACD alignment.
✴️ Conclusion: The oscillator signals oversold status, but the context suggests any bounce would be corrective, not impulsive - a trap for premature long entries.
⊢
▦ MACD (9, 21) - (MACD: -95.69 / Signal: -129.37):
∴ MACD histogram shows initial contraction of bearish momentum, but remains submerged below the zero-line and far from a clean crossover;
∴ MACD line is attempting to turn up, but the signal line remains significantly below it, indicating lack of consensus between short and medium-term momentum;
∴ Previous fake signals from MACD in this range suggest caution divergence is visible, but -structure is weak.
✴️ Conclusion: MACD shows early signs of momentum divergence, but without structure or volume, the setup remains fragile and unconfirmed.
⊢
▦ OBV + EMA9 - (OBV: 26.69K):
∴ On-Balance Volume has entered a horizontal band with no structural incline or decline for three consecutive days;
∴ OBV's 9-period EMA is now perfectly flat, reflecting market indecision and a symmetrical distribution of volume over time;
∴ No bullish or bearish divergence is visible, indicating that volume flow is passive and non-directional.
✴️ Conclusion: OBV confirms tactical silence in the order book - structure lacks engagement, and accumulation or distribution is absent.
⊢
🜎 Strategic Insight - Technical Oracle:
∴ All indicators on the H1 chart converge toward a single message: tactical drift within a structurally neutral, low-volume regime;
∴ The EMA's are aligned downward, RSI is slipping without exhaustion, MACD offers unconfirmed divergence, and Stoch RSI is oversold without structure;
∴ This constellation presents a dangerous battlefield - one where silence reigns louder than signal;
∴ Breakouts are possible, but not probable without macro ignition.
⊢
∫ II. On-Chain Intelligence - (Source: CryptoQuant):
▦ Exchange Reserves + 9EMA - (All Exchanges):
∴ Bitcoin reserves on centralized exchanges have decreased from (~2.46M) to 2.41M Bitcoin over the past 30 days, but the decline halted on July 21st and entered a horizontal range;
∴ This plateau indicates a pause in the long-term outflow trend, suggesting that neither accumulation nor distribution is dominating;
∴ Exchange reserves are a key liquidity gauge, and flatlining implies equilibrium between withdrawal behavior and deposit pressure.
✴️ Conclusion: No liquidity threat from centralized exchange reserves - a neutral signal in an inert market.
⊢
▦ Funding Rate + 9EMA - (All Exchanges):
∴ The funding rate remains mildly positive across perpetual contracts, indicating a slight long bias - (+0.008);
∴ However, the rate is far from extremes that would signify either overleveraging or liquidation risk;
∴ Historical context shows that a funding rate near zero during price stagnation often precedes volatility expansion.
✴️ Conclusion: Cautious optimism present among derivatives traders, but not enough to drive trend - latent energy, directionless.
⊢
▦ Stablecoin Ratio + 9EMA - (All Exchanges):
∴ The ratio of stablecoins to Bitcoin on exchanges remains at all-time lows, signaling an environment with reduced buying power;
∴ This lack of fresh capital severely limits the capacity for breakout rallies, especially when combined with poor volume and flat OBV;
∴ No stablecoin inflows = no fuel for upward movement.
✴️ Conclusion: The market is liquidity-starved - stablecoin ratio confirms lack of bullish firepower.
⊢
▦ Realized Cap + 9EMA:
∴ Realized Cap has surpassed the $1 trillion mark for the first time, suggesting robust conviction among holders and long-term participants;
∴ This metric rises only when coins move at a profit, indicating that active participants are not capitulating but rather holding or consolidating;
∴ The Realized Cap trajectory diverges from flat spot price - an arcane sign of underlying strength.
✴️ Conclusion: Structural confidence remains intact at the macro level - price inertia belies silent conviction.
⊢
🜎 Strategic Insight - On-Chain Oracle:
∴ On-chain metrics whisper stability;
∴ No excessive optimism, no panic, just a dry and frozen battlefield;
∴ Exchange reserves are flat, stablecoin ratio is weak, but Realized Cap shows unwavering belief; ∴ If the market breaks, it will be macro-induced - not on-chain triggered.
⊢
✴️ Codicillus Silentii - Strategic Note:
∴ The gatekeepers are at the threshold:
- Jerome Powell’s speech: July 25;
- U.S. GDP Q2 (Preliminary): July 26.
∴ Both are macro-keystones that will either ignite movement or deepen compression. The tape is silent because the world awaits signal.
⊢
𓂀 Stoic-Structural Interpretation:
▦ Structurally Neutral - Tactically Bearish Drift.
∴ EMA's aligned downward, RSI below midline, OBV stagnant - no strength, no collapse;
∴ Bearish drift, but no conviction.
▦ Tactical Range Caution:
∴ Support: $117.400 - (lower Bollinger limit);
∴ Resistance: $118.900 - (EMA cluster + BB midline).
✴️ Final Seal: Bitcoin rests under the veil of compression. Eyes turn to Powell. Silence prepares the break.
⊢
✴️ Final Codex Interpretation:
∴ The chart speaks not in fire nor fury - but in breathless tension:
Each line, curved and silent, awaits the tremor of a greater voice;
The market is not weak - it is listening. And what it hears may not be price, but power.
∴ The candles drift beneath their own gravity:
The EMA's now form a declining constellation, dimming the tactical skies;
No reversal, no collapse - only weightless time.
∴ Volume is not a storm. It is absence:
And absence in markets is not peace - it is preparation.
∴ On-chain, conviction stands with sealed lips:
Reserves unmoved, stablecoins withdrawn, but Realized Cap ascends - as if the soul of Bitcoin advances, while the flesh waits behind.
∴ And above all - the macro sphere:
Two seals remain locked: Powell’s speech and GDP;
One whispers interest rates. The other shouts reality.
⊢
- ✶ This is not a trend. It is a pause in fate;
- ✶ This is not weakness. It is breath before the chant.
⊢
✴️ Conclusion Codex Interpretation:
∴ Bitcoin is in deliberate suspension - structurally stoic, tactically inert;
∴ A sovereign asset waiting not for buyers, but for context;
∴ The gate opens July 25th. Until then: silence reigns.
⊢
⧉
· Cryptorvm Dominvs · MAGISTER ARCANVM · Vox Primordialis ·
⚜️ ⌬ - Silence precedes the next force. Structure is sacred - ⌬ ⚜️
⧉
⊢
Penerbitan berkaitan
Penafian
Maklumat dan penerbitan adalah tidak dimaksudkan untuk menjadi, dan tidak membentuk, nasihat untuk kewangan, pelaburan, perdagangan dan jenis-jenis lain atau cadangan yang dibekalkan atau disahkan oleh TradingView. Baca dengan lebih lanjut di Terma Penggunaan.
Penerbitan berkaitan
Penafian
Maklumat dan penerbitan adalah tidak dimaksudkan untuk menjadi, dan tidak membentuk, nasihat untuk kewangan, pelaburan, perdagangan dan jenis-jenis lain atau cadangan yang dibekalkan atau disahkan oleh TradingView. Baca dengan lebih lanjut di Terma Penggunaan.