https://www.tradingview.com/x/tPIOYsKb/
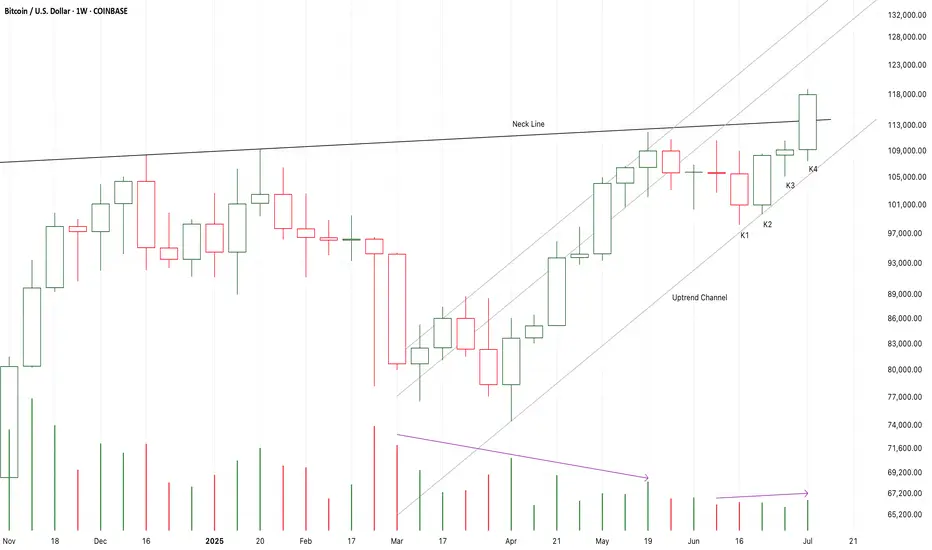
From K2 to K4,
It is a strong bullish three soldiers advancing pattern with increasing demands.
It is likely that K4 will close upon the high price area.
And, it is likely to be a valid break up here.
The potential target is about 127-130K after 3 weeks.
On the other hand,
Compared to the nearest motive move,
The demands keeps at the lowest level.
It is an early signal of weakness.
Perhaps this is a final motive wave.
I will try to get out of the market and even try to short it if the following candles move to the upper limit of the uptrend channel.
Also, I am expecting a doji candle of K5 to test the neck line.
It is a potential good place to buy it there.
Long-115518/Stop-111K/Target-127K
Long-114388/Stop-111K/Target-134K
Dagangan aktif
From K1to K3,
It is a strong bullish three soldiers stalled pattern with increasing demands.
It is likely that K4 will close upon the high price area.
And, it is likely to be a valid break up and an accelerate motive wave here.
The potential target of the double bottom consolidation pattern at about 121-128K after 3 weeks.
At the same time,
The supply pressure sharply increased at K2,
It is an early signal of weakness.
Perhaps a small scale running flat pattern will consolidate around the upper limit of the channel,
And then, the market will keep accelerating.
I will try to get out of the market and even try to short it if the following candles move to 125K area.
Long-115888/Stop-111K/Target-127K
Nota
From K1 to K3,
It is a three soldiers stalled pattern,
The volume sharply increased,
But still, it failed to close below the support.
It seems that a rebound had started earlier from K3.
The support is most likely effective here.
If K4 close upon K2 or the following candles retest the support for more times,
It will be a good place to buy it at 116K or 112K area.
On the other hand,
K2 and K3 close below the long-term uptrend line,
If K4 or the following candles successfully retest the uptrend line to verify the break down,
It is likely that the long-term uptrend will be reversed here.
I don’t think this will happen.
And,K4 failed to expand down.
The supply pressure along the consolidation channel keep decreasing.
So, it is most likely a fake down here.
Days later, the market will return back to test 123K or break up it.
Long-111188/Stop-109K/Target-123K
Nota
The supply pressure sharply decreased at K3,
So, I don’t think the long-term uptrend will be reversed here.
I am expecting a doji candle of K4 to test 0.5fib area to buy in.
On the other hand,
If K4 close below the support,
The risk will sharply increase.
Long-109888/Stop-107K/Target-123K
Nota
K4 and K5 verified the resistance,
If K6 close upon the resistance,
Or successfully retest the support,
It will be a good place to buy it then.
I am expecting a head-shoulder pattern to reverse the short-term downtrend.
Long-114388/Target-120K/Stop-113700
Penafian
Maklumat dan penerbitan adalah tidak dimaksudkan untuk menjadi, dan tidak membentuk, nasihat untuk kewangan, pelaburan, perdagangan dan jenis-jenis lain atau cadangan yang dibekalkan atau disahkan oleh TradingView. Baca dengan lebih lanjut di Terma Penggunaan.
Penafian
Maklumat dan penerbitan adalah tidak dimaksudkan untuk menjadi, dan tidak membentuk, nasihat untuk kewangan, pelaburan, perdagangan dan jenis-jenis lain atau cadangan yang dibekalkan atau disahkan oleh TradingView. Baca dengan lebih lanjut di Terma Penggunaan.