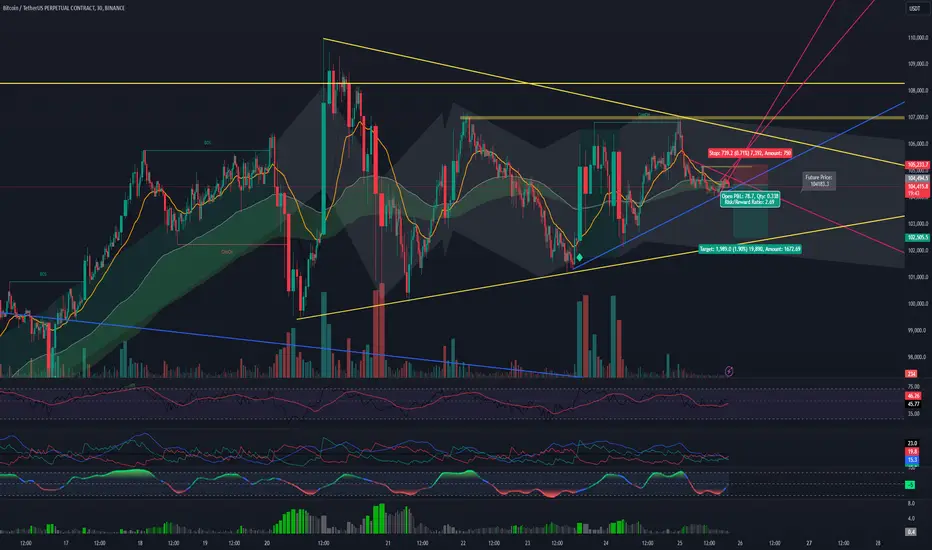
Resistance Rejection: Price rejected at a horizontal resistance zone, showing bearish pressure with wick formations indicating seller dominance.
Trendline Respect: Price respects a descending trendline, supporting bearish continuation probabilities.
EMA Confluence: Below the 50 EMA, signaling weakening bullish momentum.
Volume Decline: Reduced buying volume suggests fading demand, aligning with bearish sentiment.
Indicators Align Bearish:
RSI trending downward near midline.
MACD showing a potential bearish crossover.
Risk/Reward: Favorable 2.09 ratio, with clear invalidation above resistance and significant downside potential.
Cloud Base Test: A break below the Ichimoku Cloud base could accelerate bearish movement.
Probabilities:
Bearish Continuation: ~65%.
Bullish Recovery: ~35%.
Plan:
Entry: On a breakdown below horizontal support.
Stop Loss: Above resistance.
Target: Next support zone or lower trendline.
Multiple confirmations favor a short trade setup. Manage risk effectively.
A Haque
Founder | MyTradingJournal
📊 Financial Market Analyst | Trader | Educator
🐦 Twitter: @MyTradingJnl6th
📺 YouTube: @MyTradingJournal6th
Founder | MyTradingJournal
📊 Financial Market Analyst | Trader | Educator
🐦 Twitter: @MyTradingJnl6th
📺 YouTube: @MyTradingJournal6th
Penafian
Maklumat dan penerbitan adalah tidak dimaksudkan untuk menjadi, dan tidak membentuk, nasihat untuk kewangan, pelaburan, perdagangan dan jenis-jenis lain atau cadangan yang dibekalkan atau disahkan oleh TradingView. Baca dengan lebih lanjut di Terma Penggunaan.