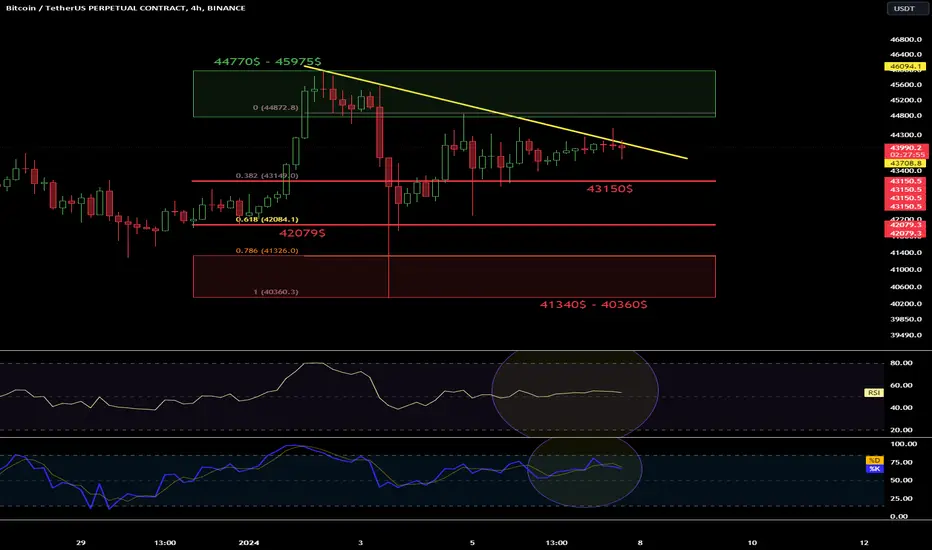
Hello everyone, let's take a look at the BTC to USDT chart on a 4-hour time frame. As you can see, the price is fighting against the local downtrend line.
However, when we unfold the fib retracement grid, we can see that the price is being rejected by a strong resistance zone from $44,770 to $45,957, which is keeping the price from moving towards $48,000.
Looking the other way, there is support at $43,150, second at $42,079, and then a strong support zone from $41,340 to $40,360.
On the RSI indicator, we are moving in the upper part of the range, while the STOCH indicator is in the upper part at the upper limit, which may translate into a price drop.
Penafian
Maklumat dan penerbitan adalah tidak dimaksudkan untuk menjadi, dan tidak membentuk, nasihat untuk kewangan, pelaburan, perdagangan dan jenis-jenis lain atau cadangan yang dibekalkan atau disahkan oleh TradingView. Baca dengan lebih lanjut di Terma Penggunaan.
Penafian
Maklumat dan penerbitan adalah tidak dimaksudkan untuk menjadi, dan tidak membentuk, nasihat untuk kewangan, pelaburan, perdagangan dan jenis-jenis lain atau cadangan yang dibekalkan atau disahkan oleh TradingView. Baca dengan lebih lanjut di Terma Penggunaan.