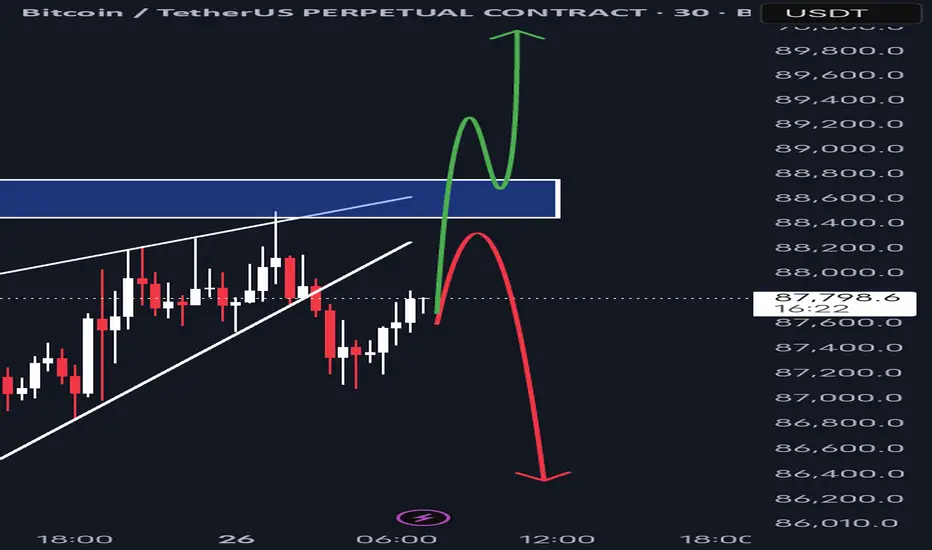
Bitcoin recently broken down the Rising wedge pattern in lower timeframe which is a bearish sign that usually means it will keep going down. But, it might not!
It can be a fakeout: Incase if the price goes back up and managed to break the Horizontal resistance, then the earlier breakdown was probably fake, and the price might go up.
Or it might really go down: If the price keeps falling, it could form a Double top pattern which is another bearish pattern.
So, we need to wait and see what happens, It could go either way.
Penafian
Maklumat dan penerbitan adalah tidak dimaksudkan untuk menjadi, dan tidak membentuk, nasihat untuk kewangan, pelaburan, perdagangan dan jenis-jenis lain atau cadangan yang dibekalkan atau disahkan oleh TradingView. Baca dengan lebih lanjut di Terma Penggunaan.
Penafian
Maklumat dan penerbitan adalah tidak dimaksudkan untuk menjadi, dan tidak membentuk, nasihat untuk kewangan, pelaburan, perdagangan dan jenis-jenis lain atau cadangan yang dibekalkan atau disahkan oleh TradingView. Baca dengan lebih lanjut di Terma Penggunaan.
