📊 BTCUSDT – 1H Chart Analysis
Current Structure
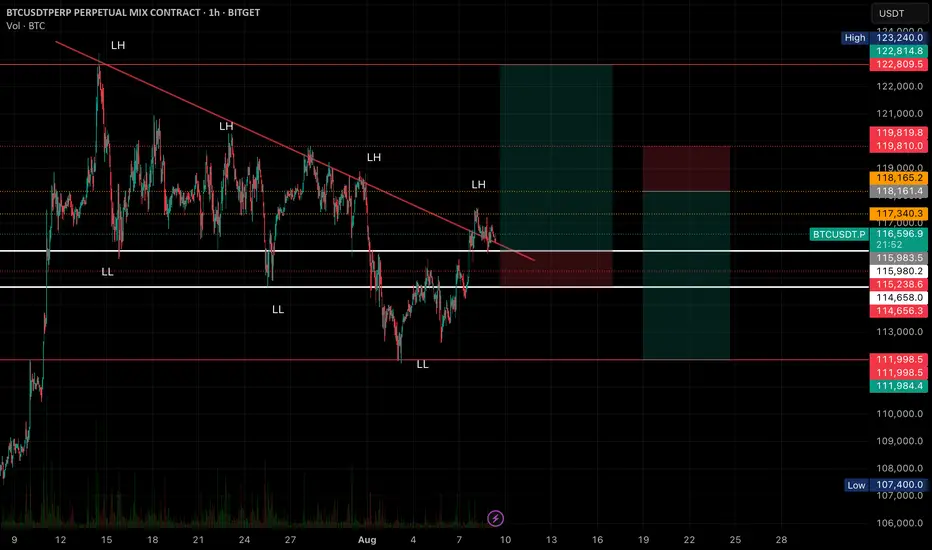
• Market has been in a downtrend with a sequence of Lower Highs (LH) and Lower Lows (LL).
• Price recently broke above the descending trendline and is now testing it for support.
• Key horizontal levels marked in white and red provide both breakout and rejection opportunities.
⸻
📈 Bullish Scenario (Breakout Confirmation)
• Trigger: If price holds above 116,000 – 116,200 and closes 1H above trendline.
• Entry Zone: 116,500 – 116,800 (post retest confirmation)
• Targets:
• TP1: 117,340 (immediate resistance)
• TP2: 118,165 (strong supply zone)
• Extended: 119,810 – 122,800 (major liquidity zone)
• Stop Loss: Below 115,980 (trendline break + support fail)
⸻
📉 Bearish Scenario (Rejection & Breakdown)
• Trigger: If price fails to hold above the trendline and breaks below 115,980.
• Entry Zone: 115,800 – 115,500 (after breakdown retest)
• Targets:
• TP1: 115,238 (previous demand)
• TP2: 114,656 (strong support)
• Extended: 112,000 – 111,984 (major demand)
• Stop Loss: Above 116,700 (fakeout invalidation)
⸻
💡 Summary:
• Bulls need a clean hold above the trendline to reverse the downtrend structure.
• Bears regain control if support breaks and price returns inside the descending channel.
• Watch volume closely — a breakout with weak volume may lead to a fakeout.
Current Structure
• Market has been in a downtrend with a sequence of Lower Highs (LH) and Lower Lows (LL).
• Price recently broke above the descending trendline and is now testing it for support.
• Key horizontal levels marked in white and red provide both breakout and rejection opportunities.
⸻
📈 Bullish Scenario (Breakout Confirmation)
• Trigger: If price holds above 116,000 – 116,200 and closes 1H above trendline.
• Entry Zone: 116,500 – 116,800 (post retest confirmation)
• Targets:
• TP1: 117,340 (immediate resistance)
• TP2: 118,165 (strong supply zone)
• Extended: 119,810 – 122,800 (major liquidity zone)
• Stop Loss: Below 115,980 (trendline break + support fail)
⸻
📉 Bearish Scenario (Rejection & Breakdown)
• Trigger: If price fails to hold above the trendline and breaks below 115,980.
• Entry Zone: 115,800 – 115,500 (after breakdown retest)
• Targets:
• TP1: 115,238 (previous demand)
• TP2: 114,656 (strong support)
• Extended: 112,000 – 111,984 (major demand)
• Stop Loss: Above 116,700 (fakeout invalidation)
⸻
💡 Summary:
• Bulls need a clean hold above the trendline to reverse the downtrend structure.
• Bears regain control if support breaks and price returns inside the descending channel.
• Watch volume closely — a breakout with weak volume may lead to a fakeout.
Penafian
The information and publications are not meant to be, and do not constitute, financial, investment, trading, or other types of advice or recommendations supplied or endorsed by TradingView. Read more in the Terms of Use.
Penafian
The information and publications are not meant to be, and do not constitute, financial, investment, trading, or other types of advice or recommendations supplied or endorsed by TradingView. Read more in the Terms of Use.