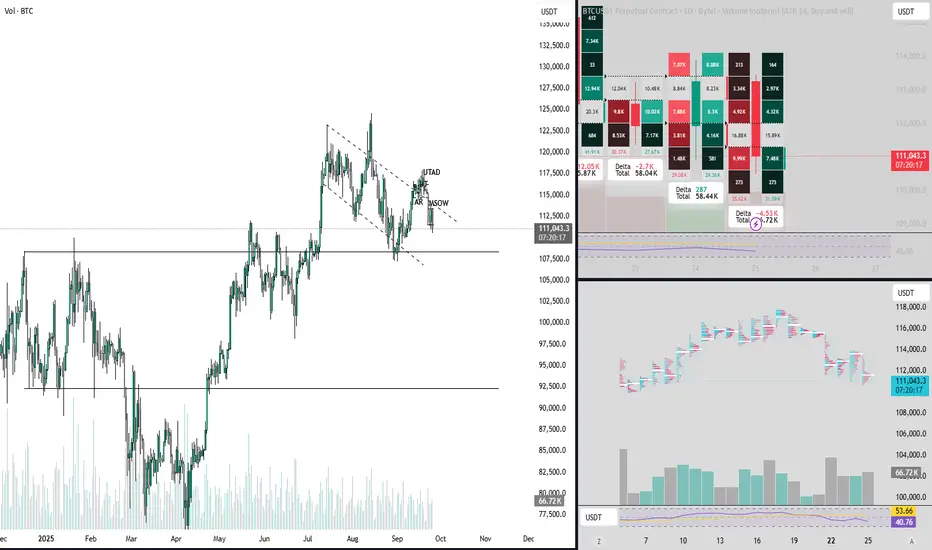
Over the past few days, Bitcoin has shown a clear weakness. On the footprint chart, we can see aggressive selling pressure with almost no real buying response. Every small attempt to push higher gets absorbed immediately by sellers. In simple words – sellers are in control, buyers are silent.
Looking at the Volume Profile, the next meaningful target/support area sits around $109,000 per coin. If the current pressure continues, that’s the area where price could be heading to find balance.
From a Wyckoff perspective, Bitcoin is right in the middle of a Distribution phase – a stage where big players are unloading their positions onto retail traders. Usually, during this phase, the public still believes the market is strong, while in reality large players are preparing the ground for a bigger move down.
Zooming out to the broader picture, equity markets are also highly priced. The Buffett Indicator – which measures the ratio between the total stock market value and GDP – is currently sitting at historically high levels. This is one of the most reliable signals that markets are overvalued compared to the real economy.
Recent news also highlights the same point: valuations keep stretching, company P/E ratios are expanding, while economic growth is showing signs of slowing down. That combination – high valuations with slowing growth – has often been the recipe for sharp corrections.
Bottom line: Both Bitcoin and the stock market are showing stretched valuations and clear selling pressure. It doesn’t mean a crash tomorrow, but it does mean caution is needed. Small rallies shouldn’t be confused with strength – the risk of a meaningful correction is definitely on the table.
meitar Fadida Israel
Penafian
Maklumat dan penerbitan adalah tidak dimaksudkan untuk menjadi, dan tidak membentuk, nasihat untuk kewangan, pelaburan, perdagangan dan jenis-jenis lain atau cadangan yang dibekalkan atau disahkan oleh TradingView. Baca dengan lebih lanjut di Terma Penggunaan.
meitar Fadida Israel
Penafian
Maklumat dan penerbitan adalah tidak dimaksudkan untuk menjadi, dan tidak membentuk, nasihat untuk kewangan, pelaburan, perdagangan dan jenis-jenis lain atau cadangan yang dibekalkan atau disahkan oleh TradingView. Baca dengan lebih lanjut di Terma Penggunaan.
