https://www.tradingview.com/x/CSqZwlpO/
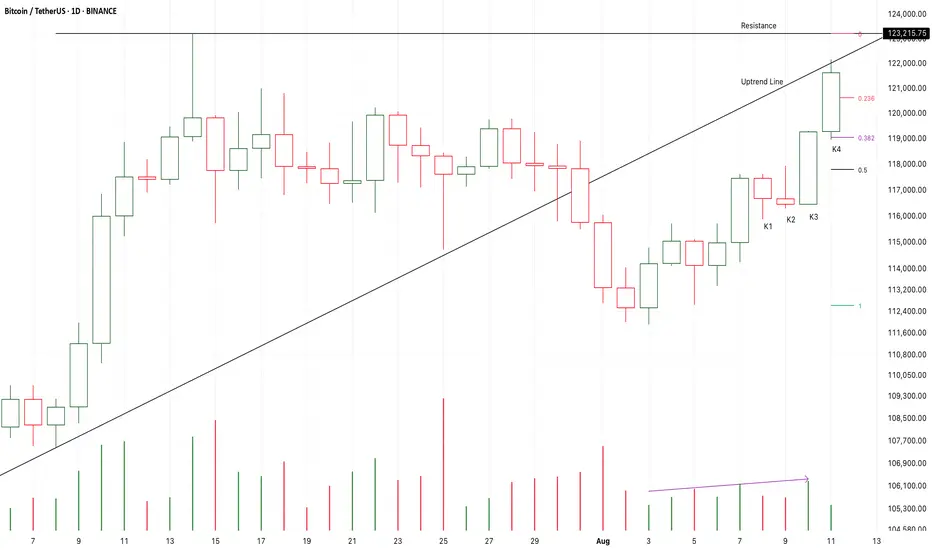
K3 and K4 verified an accelerating motive wave of a short-term uptrend.
I am leaving from 119K to 123K.
I am expecting a consolidation around the resistance.
If the following candles fall to test 0.5fib area,
I will try to buy it there.
Long-118K/Target-125K/Stop-116.5K
K3 and K4 verified an accelerating motive wave of a short-term uptrend.
I am leaving from 119K to 123K.
I am expecting a consolidation around the resistance.
If the following candles fall to test 0.5fib area,
I will try to buy it there.
Long-118K/Target-125K/Stop-116.5K
Nota
From k1 to k3,
It is a three soldiers advancing pattern under increasing supply pressure.
It break down the long-term uptrend line here.
At the same time,
It failed to close below the neck line of a large scale double top pattern.
It seems that a rebound or another bull run had started from K4.
If the following candles return back to verify the strength of the uptrend line,
It will be a good place to short it or get out the market.
I am expecting a Triple top pattern or Head-shoulder pattern to terminate the previous three years bull market.
Short-120K/Stop-125K/Target-60K
Nota
From K2 to K4,
It is a three soldiers advancing pattern under increasing supply pressure.
It break down the neckline of a potential double top pattern.
If the follow candles successfully retest the neckline to verify a valid break down,
It is likely that the market will keep falling to test 98K area.
On the other hand,
If the following candles return back upon the neck line to verify a fake down,
Or, the following candles failed to accelerate to expand down,
It is likely that a rebound or another bull run will start here.
I am expecting a rebound to test 120K area again.
Long-108188/Stop-107188/Target-117K
Short-118444/Stop-119444/Target-98K
Penafian
Maklumat dan penerbitan adalah tidak dimaksudkan untuk menjadi, dan tidak membentuk, nasihat untuk kewangan, pelaburan, perdagangan dan jenis-jenis lain atau cadangan yang dibekalkan atau disahkan oleh TradingView. Baca dengan lebih lanjut di Terma Penggunaan.
Penafian
Maklumat dan penerbitan adalah tidak dimaksudkan untuk menjadi, dan tidak membentuk, nasihat untuk kewangan, pelaburan, perdagangan dan jenis-jenis lain atau cadangan yang dibekalkan atau disahkan oleh TradingView. Baca dengan lebih lanjut di Terma Penggunaan.