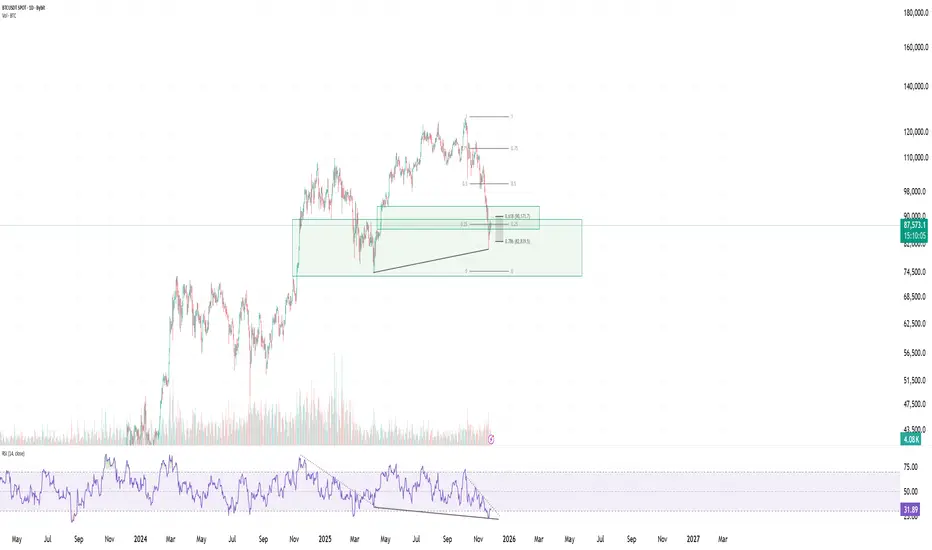
BTC has now reached a major extreme discount zone, completing a deep retracement into one of the strongest demand regions on the chart. This level aligns perfectly with key Fibonacci supports, making it a high-value area from a technical perspective.
Price has tapped the 0.618 – 0.786 Fibonacci cluster, which historically provides strong reactions during corrective phases. Combined with a clearly defined demand block, this forms a confluence that often marks the end of a corrective leg rather than the beginning of a deeper breakdown.
At the same time, the RSI is showing a hidden bullish divergence, where price makes a higher low while RSI makes a lower low. This pattern typically appears during continuation setups and suggests that underlying bullish strength may be returning despite the aggressive downside move.
These elements together create a scenario where the market is positioned in a high-probability reaction zone. As long as BTC holds above the key demand structure, the technicals support the idea of an upward continuation forming from here.
Key Technical Highlights:
• Strong confluence between the 0.618 – 0.786 Fibs
• Price is inside a major discount demand zone
• RSI showing hidden bullish divergence (continuation signal)
• Structure still supportive of an upside bounce as long as demand holds
• Market conditions resemble previous early-reversal zones
In simple terms: BTC is sitting inside a major discount area, touching the strongest Fibonacci supports, and RSI is flashing a hidden bullish signal. If this zone holds, it may mark the beginning of a recovery phase.
Market Structure • Price Action • Crypto Updates
🔗 Telegram: t.me/Coach
🔗 Telegram: t.me/Coach
Penafian
The information and publications are not meant to be, and do not constitute, financial, investment, trading, or other types of advice or recommendations supplied or endorsed by TradingView. Read more in the Terms of Use.