Hi everyone.
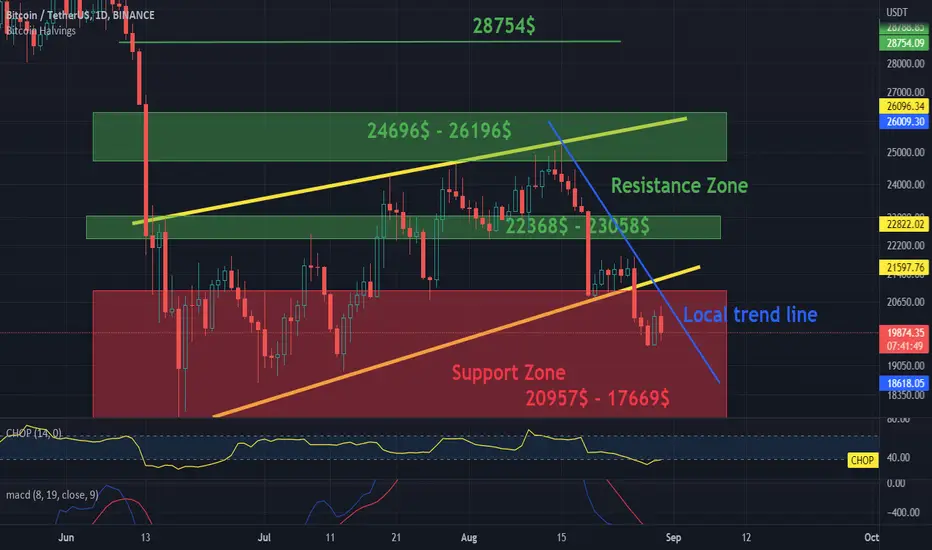
Today we marked the uptrend channel with yellow lines, which was broken at the bottom and now the price is below the local downtrend line.
As you can see, we have an important support zone:
-the support zone in which the BTC price is currently located from $ 20,957 to $ 17,669, if the price drops below the designated zone, we can expect further drops to around $ 12,000.
Then we have the first resistance zone from $ 22,368 to $ 23058 if we break it, then we have a resistance zone from $ 24,696 to $ 26,196. A break from this zone could result in further gains towards the resistance at $ 28,754.
Also noteworthy is the CHOP indicator, which indicates that we have a lot of energy, and the MACD indicator, which indicates that we are on the verge of entering a downtrend.
Remember, however, that this is not investment advice.
Penafian
Maklumat dan penerbitan adalah tidak dimaksudkan untuk menjadi, dan tidak membentuk, nasihat untuk kewangan, pelaburan, perdagangan dan jenis-jenis lain atau cadangan yang dibekalkan atau disahkan oleh TradingView. Baca dengan lebih lanjut di Terma Penggunaan.
Penafian
Maklumat dan penerbitan adalah tidak dimaksudkan untuk menjadi, dan tidak membentuk, nasihat untuk kewangan, pelaburan, perdagangan dan jenis-jenis lain atau cadangan yang dibekalkan atau disahkan oleh TradingView. Baca dengan lebih lanjut di Terma Penggunaan.