The recent action by the 
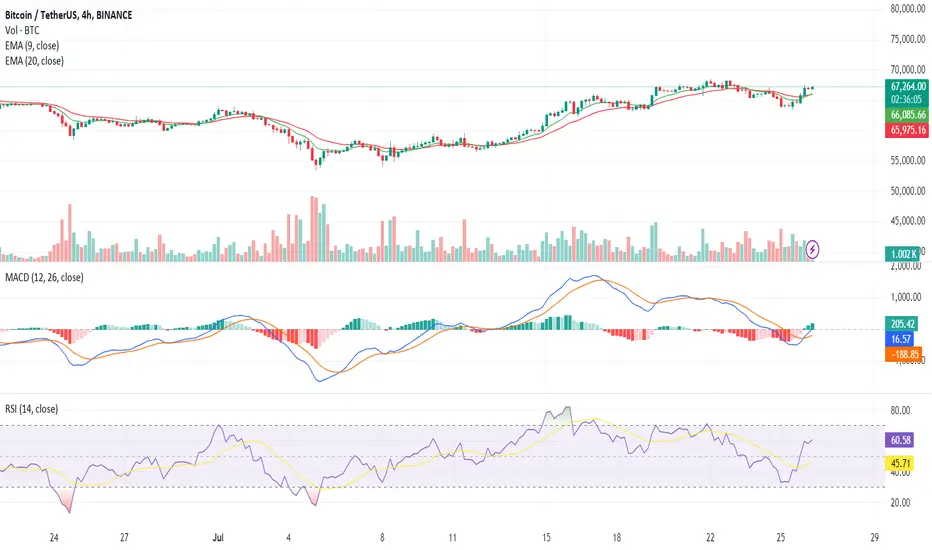
 BTCUSDT on the 4-hour chart showcases significant volatility, with BTC closing at $67,086.0, marginally down from its previous peak. This movement reflects the ongoing tug-of-war between bullish and bearish sentiments in the market.
BTC is trading close to critical resistance levels of $67,157.26, $67,195.1, and $67,224.0. These resistance levels are crucial barriers that Bitcoin needs to overcome to confirm a continued bullish trend. On the downside, Bitcoin finds support at $66,823.63, $66,470.01, and $66,244.48, which have so far held against bearish pressures, providing a safety net for traders.
Exponential Moving Averages (EMAs) indicate a mixed sentiment. The 9 EMA is trending upward, currently at $66,050.06, which shows short-term bullish momentum. However, the 20 EMA at $65,958.20 is slightly lagging, indicating a need for stronger upward movement to solidify a bullish trend.
Meanwhile, the Moving Average Convergence Divergence (MACD) highlights an interesting scenario. The MACD line has crossed above the signal line, transitioning from a bearish to a bullish histogram. This shift suggests growing bullish momentum, but caution is advised as the MACD values are still recovering from negative territory.
The Relative Strength Index (RSI) hovers around 59.48, slightly below the overbought threshold of 70. This indicates that while there is buying interest, Bitcoin is not yet in overbought territory, allowing room for further upward movement without immediate risk of a pullback.
For those looking to enter long positions, a confirmed breakout above the resistance at $67,224.0 could present a lucrative opportunity, targeting higher levels with a stop-loss just below the support at $66,823.63. This strategy would capitalize on the bullish signals from the MACD and RSI indicators.
Conversely, traders considering short positions might look for signs of rejection at the resistance levels, with a potential entry below $67,157.26. Setting a stop-loss just above $67,224.0 can mitigate risk, with profit targets near the support zones of $66,470.01 and $66,244.48.
Disclaimer: The information presented in this article is for informational and educational purposes only. The article does not constitute financial advice or advice of any kind. Ecoinimist is not responsible for any losses incurred as a result of the utilization of content, products, or services mentioned. Readers are advised to exercise caution before taking any action related to the company.
Penafian
Maklumat dan penerbitan adalah tidak dimaksudkan untuk menjadi, dan tidak membentuk, nasihat untuk kewangan, pelaburan, perdagangan dan jenis-jenis lain atau cadangan yang dibekalkan atau disahkan oleh TradingView. Baca dengan lebih lanjut di Terma Penggunaan.
Penafian
Maklumat dan penerbitan adalah tidak dimaksudkan untuk menjadi, dan tidak membentuk, nasihat untuk kewangan, pelaburan, perdagangan dan jenis-jenis lain atau cadangan yang dibekalkan atau disahkan oleh TradingView. Baca dengan lebih lanjut di Terma Penggunaan.