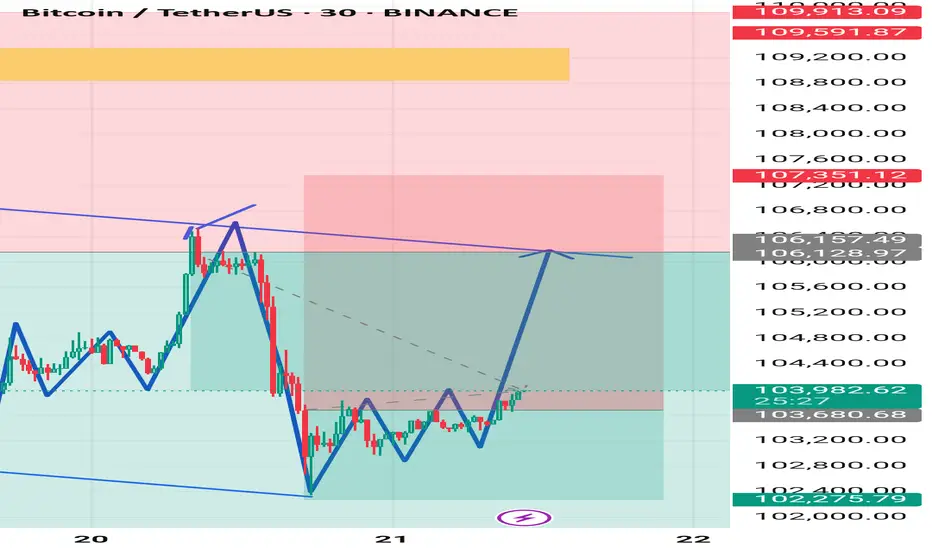
This chart is a 30-minute BTC/USDT (Bitcoin/Tether) technical analysis from Binance, showing a potential bullish setup. Here's a breakdown of the key elements:
1. Descending Broadening Wedge
The blue trendlines forming a broadening wedge indicate a reversal pattern.
Price has been moving within this structure and recently broke out from the bottom back toward the upper resistance line.
This pattern typically ends with a bullish breakout, especially after consolidation near the lower boundary.
2. Key Zones
Support Zone: Around $102,275 – $103,680 (light green zone).
Resistance Zone: Between $106,128 – $107,351 (light red zone), with an extended resistance up to ~$109,591 (dark red line).
3. Pattern Suggestion
The blue zigzag lines suggest a possible Inverse Head and Shoulders pattern near the current price area, indicating a bullish reversal.
A projected price path (in dotted grey) hints at a bullish move targeting the upper trendline near $106,128–$106,157, potentially a 16th–21st June breakout setup.
4. Price Action
Current price: $103,982.63, with moderate momentum (+0.66%).
The arrow projection suggests a bullish move targeting the upper resistance zone.
---
Summary:
Bias: Bullish short-term outlook.
Target Zone: $106,100–$107,300.
Invalidation: Drop below $102,275 may negate the bullish setup.
Let me know if you'd like an entry/exit plan, risk/reward analysis, or a trading strategy based on this setup.
t.me/+EQ88IkMSUvQwMGJk
Join telegram channel free
t.me/+EQ88IkMSUvQwMGJk
Join telegram channel free
t.me/+EQ88IkMSUvQwMGJk
Penafian
Maklumat dan penerbitan adalah tidak dimaksudkan untuk menjadi, dan tidak membentuk, nasihat untuk kewangan, pelaburan, perdagangan dan jenis-jenis lain atau cadangan yang dibekalkan atau disahkan oleh TradingView. Baca dengan lebih lanjut di Terma Penggunaan.
t.me/+EQ88IkMSUvQwMGJk
Join telegram channel free
t.me/+EQ88IkMSUvQwMGJk
Join telegram channel free
t.me/+EQ88IkMSUvQwMGJk
Penafian
Maklumat dan penerbitan adalah tidak dimaksudkan untuk menjadi, dan tidak membentuk, nasihat untuk kewangan, pelaburan, perdagangan dan jenis-jenis lain atau cadangan yang dibekalkan atau disahkan oleh TradingView. Baca dengan lebih lanjut di Terma Penggunaan.