❄️ Welcome to the cryptos winter , I hope you’ve started your day well.
⏰ We’re analyzing BTC on the 15-Minutes timeframe .
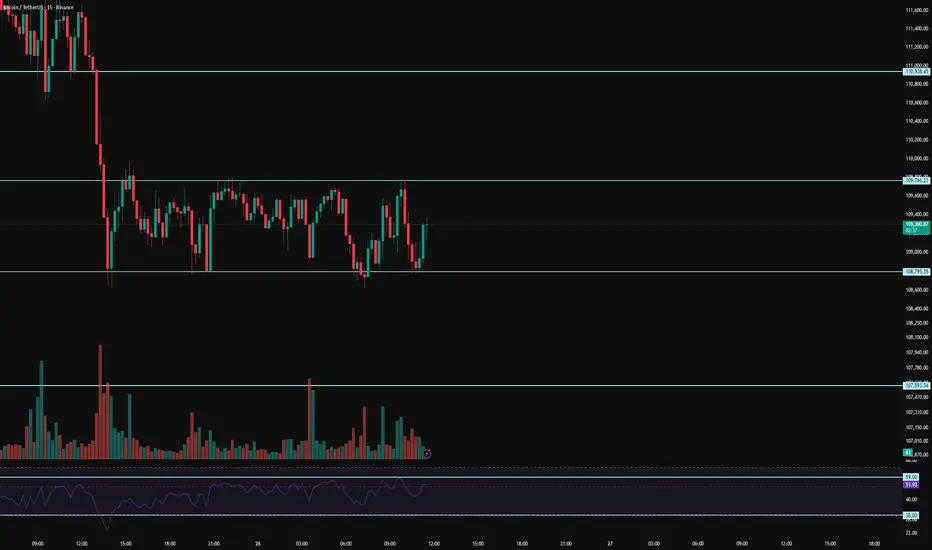
👀 After several days of decline from the zones we previously identified, we are back to analyze Bitcoin for you. On the 15-minute timeframe, Bitcoin is consolidating above the $108,800 support level, with the upper boundary of this consolidation at $109,760. A breakout above this level could signal the beginning of a new structure and trend. A breakdown below support, however, seems less convincing for a short position, as many traders who feel they missed out are now stepping in to buy. Current support zones are acting as both maker and taker buy levels. Bitcoin requires increased volume to confirm either a breakout or breakdown. With the upcoming weekend, however, risks must be carefully managed due to typically lower market activity.
🧮 Looking at the RSI oscillator, it is currently holding above the 50 level but facing resistance around 59. A breakout above 59 could enable Bitcoin to break consolidation resistance and push higher. On the other hand, a key zone lies near the oversold boundary; if Bitcoin enters this area, selling pressure could intensify and trigger a deeper correction.
🕯 Candle size and volume on the 15-minute chart remain within a range. We must wait for significant volume inflow—either upward or downward—to confirm direction. Bitcoin is shaping a new structure for the upcoming week, so patience is required until a breakout with decisive green or red candles occurs.
🧠 Trading outlook: It is preferable to wait for market structure to mature, with multiple tests of both support and resistance. The candlestick type used for entry is crucial, along with momentum confirmation at key RSI levels. A breakout above $109,766 combined with RSI surpassing 59 could provide a long setup. A breakdown below $108,795 combined with RSI falling below 30 and stronger selling pressure could trigger a short setup. Keep in mind that weekend trading usually comes with lower volume, which may result in indecisive structures—unless an unexpected global event sparks volatility.
❤️ Disclaimer : This analysis is purely based on my personal opinion and I only trade if the stated triggers are activated .
⏰ We’re analyzing BTC on the 15-Minutes timeframe .
👀 After several days of decline from the zones we previously identified, we are back to analyze Bitcoin for you. On the 15-minute timeframe, Bitcoin is consolidating above the $108,800 support level, with the upper boundary of this consolidation at $109,760. A breakout above this level could signal the beginning of a new structure and trend. A breakdown below support, however, seems less convincing for a short position, as many traders who feel they missed out are now stepping in to buy. Current support zones are acting as both maker and taker buy levels. Bitcoin requires increased volume to confirm either a breakout or breakdown. With the upcoming weekend, however, risks must be carefully managed due to typically lower market activity.
🧮 Looking at the RSI oscillator, it is currently holding above the 50 level but facing resistance around 59. A breakout above 59 could enable Bitcoin to break consolidation resistance and push higher. On the other hand, a key zone lies near the oversold boundary; if Bitcoin enters this area, selling pressure could intensify and trigger a deeper correction.
🕯 Candle size and volume on the 15-minute chart remain within a range. We must wait for significant volume inflow—either upward or downward—to confirm direction. Bitcoin is shaping a new structure for the upcoming week, so patience is required until a breakout with decisive green or red candles occurs.
🧠 Trading outlook: It is preferable to wait for market structure to mature, with multiple tests of both support and resistance. The candlestick type used for entry is crucial, along with momentum confirmation at key RSI levels. A breakout above $109,766 combined with RSI surpassing 59 could provide a long setup. A breakdown below $108,795 combined with RSI falling below 30 and stronger selling pressure could trigger a short setup. Keep in mind that weekend trading usually comes with lower volume, which may result in indecisive structures—unless an unexpected global event sparks volatility.
❤️ Disclaimer : This analysis is purely based on my personal opinion and I only trade if the stated triggers are activated .
Penerbitan berkaitan
Penafian
Maklumat dan penerbitan adalah tidak dimaksudkan untuk menjadi, dan tidak membentuk, nasihat untuk kewangan, pelaburan, perdagangan dan jenis-jenis lain atau cadangan yang dibekalkan atau disahkan oleh TradingView. Baca dengan lebih lanjut di Terma Penggunaan.
Penerbitan berkaitan
Penafian
Maklumat dan penerbitan adalah tidak dimaksudkan untuk menjadi, dan tidak membentuk, nasihat untuk kewangan, pelaburan, perdagangan dan jenis-jenis lain atau cadangan yang dibekalkan atau disahkan oleh TradingView. Baca dengan lebih lanjut di Terma Penggunaan.