https://www.tradingview.com/x/LTnrHRBE/
Trend Analysi:
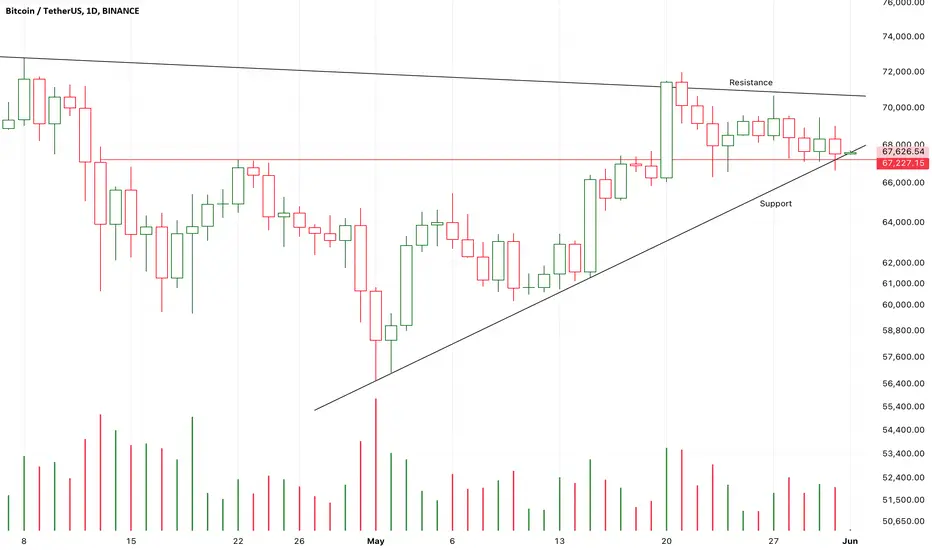
From the chart, we can see that after experiencing a downtrend, Bitcoin's price is currently in a relatively stable consolidation range.
The recent price action shows Bitcoin fluctuating between $67,000 and $70,000. Although there have been several attempts to break through $70,000, they have all failed, and the price is currently around $67,650.
Support and Resistance Levels:
Support Level: The current support level is around $67,000, which is a strong support area. If the price breaks below this support level, it may further decline to around $60,000.
Resistance Level: The main resistance level is around $70,000. If the price can effectively break through this resistance, it may usher in a new round of upward movement.
Candlestick Patterns:
The recent candlestick patterns show a few bullish candles, but overall, the price movement is not significant, indicating market hesitation.
Observing the trading volume, we can see an increase in volume in recent days, indicating increased market activity, which may suggest a significant price movement ahead.
Conclusion
Combining the above analysis, Bitcoin is currently at a key support level, and the increase in trading volume indicates higher market activity. If it can hold above $67,000 and show signs of breaking upwards, it may be considered a good point to start building a long position. However, close attention should be paid to market movements and volume changes to prevent risks if the price breaks below the support level.
Operational Suggestions:
Aggressive Investors: Can start building long positions around $67,000, with a stop loss set below $66,000.
Conservative Investors: Wait for the price to break and hold above $70,000 before entering a long position to confirm the upward trend.
Please proceed with caution based on your personal risk tolerance and market conditions. It is advisable to combine this with other technical indicators and market information for comprehensive analysis.
Trend Analysi:
From the chart, we can see that after experiencing a downtrend, Bitcoin's price is currently in a relatively stable consolidation range.
The recent price action shows Bitcoin fluctuating between $67,000 and $70,000. Although there have been several attempts to break through $70,000, they have all failed, and the price is currently around $67,650.
Support and Resistance Levels:
Support Level: The current support level is around $67,000, which is a strong support area. If the price breaks below this support level, it may further decline to around $60,000.
Resistance Level: The main resistance level is around $70,000. If the price can effectively break through this resistance, it may usher in a new round of upward movement.
Candlestick Patterns:
The recent candlestick patterns show a few bullish candles, but overall, the price movement is not significant, indicating market hesitation.
Observing the trading volume, we can see an increase in volume in recent days, indicating increased market activity, which may suggest a significant price movement ahead.
Conclusion
Combining the above analysis, Bitcoin is currently at a key support level, and the increase in trading volume indicates higher market activity. If it can hold above $67,000 and show signs of breaking upwards, it may be considered a good point to start building a long position. However, close attention should be paid to market movements and volume changes to prevent risks if the price breaks below the support level.
Operational Suggestions:
Aggressive Investors: Can start building long positions around $67,000, with a stop loss set below $66,000.
Conservative Investors: Wait for the price to break and hold above $70,000 before entering a long position to confirm the upward trend.
Please proceed with caution based on your personal risk tolerance and market conditions. It is advisable to combine this with other technical indicators and market information for comprehensive analysis.
Nota
Comprehensive Analysis of Bitcoin Daily, Weekly, and Monthly ChartsDaily Chart Analysis
The daily chart indicates that Bitcoin is consolidating around the $67,000 level, with a balance of power between bulls and bears. Currently, the price is fluctuating horizontally at a high level, and the trading volume is relatively low, reflecting a cautious market sentiment. It is crucial to monitor the breakout of short-term support and resistance levels. If the price breaks above the resistance level, further upward movement is expected; if it breaks below the support level, a correction may occur.
Weekly Chart Analysis
The weekly chart shows that Bitcoin has entered a horizontal consolidation phase after a significant rise. The price fluctuates between $66,000 and $69,000, with decreasing trading volume, indicating a weakening upward momentum. However, the overall trend remains upward. If it breaks through the $69,000 resistance level, it is likely to continue rising.
Monthly Chart Analysis
The monthly chart reveals a strong upward trend for Bitcoin starting from 2023, with the price consolidating around the $67,000 level. Although the upward momentum has weakened, the overall upward trend remains intact. If the price can sustain above $60,000, the long-term bullish pattern for Bitcoin remains.
Trading Recommendations
Short-term Traders: Focus on the support level at $67,000 and the resistance level at $69,000, employing a strategy of selling high and buying low. Set stop-loss orders at critical levels to avoid risks from sudden market movements.
Medium to Long-term Investors: If the price sustains above $60,000, consider buying on dips and holding for future gains. Long-term, Bitcoin still has considerable upside potential, but be mindful of market volatility risks.
Risk Control: Whether short-term or long-term traders, always set stop-loss levels and adjust strategies according to market changes to avoid losses from significant market fluctuations.
Nota
A decreasing supply pressure means the candles will keep climbing up.
It seems that the following candles will keep pricing up to test 71-72K area.
If K4 close upon the resistance or K1,
Another bull run will likely start here.
But I don’t think it is a good place to increase long positions,
It is just a large scale consolidation here.
Keep half of long poisons in the market will be Ok.
Nota
K1 tested the resistance,
The supply pressure is still at high level temporarily.
If the demands sharply decrease in the following candles or the supply pressure keep increasing,
The nearest support at 66.6K will be destroyed.
Dagangan ditutup: hentian tercapai
Penafian
Maklumat dan penerbitan adalah tidak dimaksudkan untuk menjadi, dan tidak membentuk, nasihat untuk kewangan, pelaburan, perdagangan dan jenis-jenis lain atau cadangan yang dibekalkan atau disahkan oleh TradingView. Baca dengan lebih lanjut di Terma Penggunaan.
Penafian
Maklumat dan penerbitan adalah tidak dimaksudkan untuk menjadi, dan tidak membentuk, nasihat untuk kewangan, pelaburan, perdagangan dan jenis-jenis lain atau cadangan yang dibekalkan atau disahkan oleh TradingView. Baca dengan lebih lanjut di Terma Penggunaan.