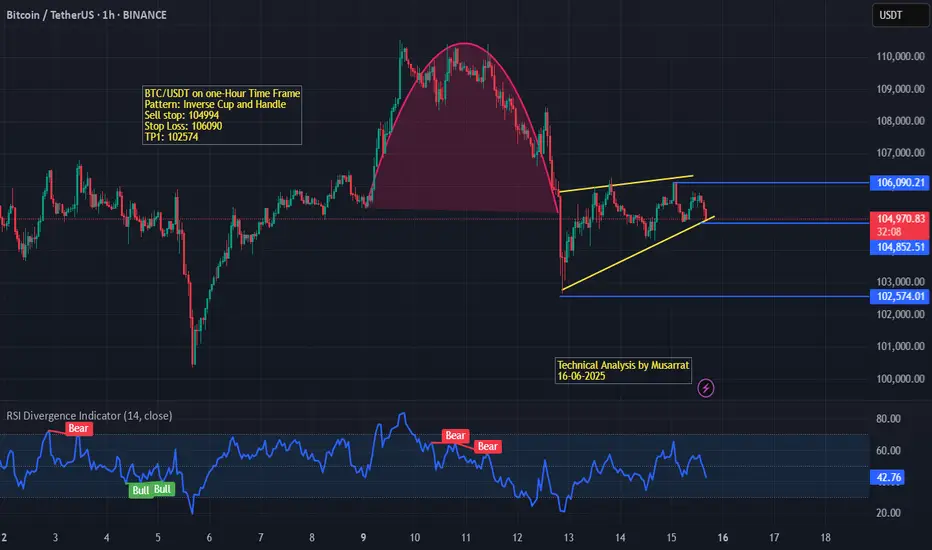
The chart illustrates a classic Inverse Cup and Handle pattern formation. The cup is clearly marked by a rounded top, indicating a reversal structure forming after a previous uptrend. Following the breakdown from the right rim of the cup, the price action has transitioned into a bearish consolidation, forming a potential rising wedge or weak bear flag – both of which typically indicate continuation to the downside.
Key Levels & Trade Setup:
Sell Stop: 104,494
Stop Loss: 106,090
Take Profit 1 (TP1): 102,574
These levels suggest a short-selling strategy with a favorable risk-to-reward setup targeting the breakdown of the handle portion of the pattern.
Indicators:
RSI (14, close) is currently at 42.95, which lies in the neutral-to-bearish territory.
Multiple Bearish RSI Divergences were signaled before the recent drop, supporting the short thesis.
Minor Bullish RSI signals were observed earlier but failed to sustain momentum above the 50 line.
Conclusion:
The technical structure, along with bearish RSI signals and pattern confirmation, suggests that BTC/USDT is likely to experience further downside, especially if price breaks below the 104,494 support. A breakdown from the current ascending structure could lead to the 102,574 support zone being tested in the near term.
Penafian
Maklumat dan penerbitan adalah tidak dimaksudkan untuk menjadi, dan tidak membentuk, nasihat untuk kewangan, pelaburan, perdagangan dan jenis-jenis lain atau cadangan yang dibekalkan atau disahkan oleh TradingView. Baca dengan lebih lanjut di Terma Penggunaan.
Penafian
Maklumat dan penerbitan adalah tidak dimaksudkan untuk menjadi, dan tidak membentuk, nasihat untuk kewangan, pelaburan, perdagangan dan jenis-jenis lain atau cadangan yang dibekalkan atau disahkan oleh TradingView. Baca dengan lebih lanjut di Terma Penggunaan.