Good weekend everyone,
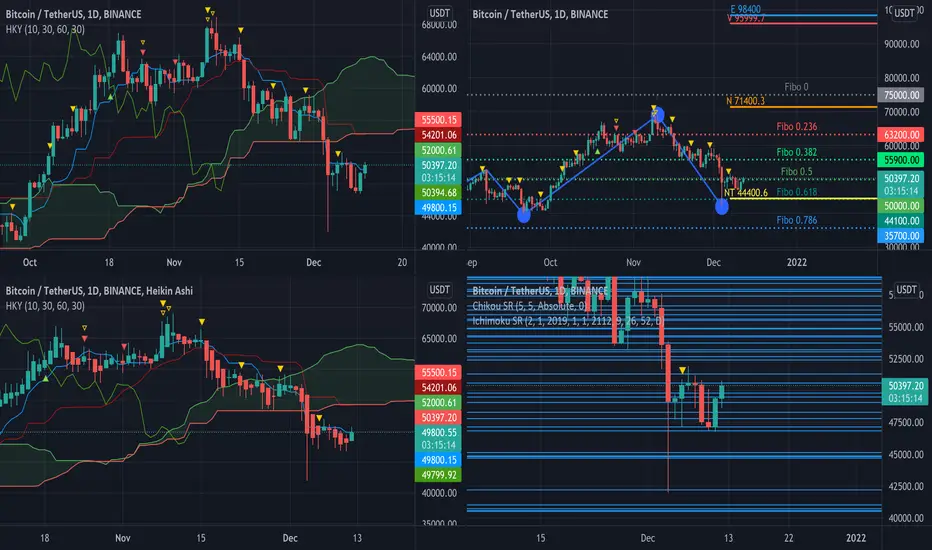
The Crypto Frog uses its Ichimoku Analysis Process with its toolset by looking at a glance at the BINANCE:BTCUSDT Daily chart using the “Crypto Market Settings” for the indicator as 10-30-60-30:
Macro Trend Analysis using Kumo:
Supports and Resistances in the area:
For the various static price structures it is possible to refer to the chart where the structures identified by the flat moments of Tenkan, Kijun, Senkou Span A and Senkou Span B on different timeframes are plotted, also Chikou price for the Current timeframe.
Moreover, let us remember that the various lines of the Ichimoku serve as price structures: the Tenkan Sen (short term), the Kijun Sen (medium term) as well as the Senkou Span A and Senkou Span B (long term).
Heikin-Ashi:
The Heikih-Ashi confirms shows a potential uptrend with the first green candle with no shadow above.
Fibonacci
CryptoFall, which identifies Fibonacci levels, still shows us a positive sentiment and places the 0 upwards on 75000.
The price is testing the 0.5 level, after the bounce on 0.618.
Conclusions
The price is now showing a potential recovery as it is surpassing the Kinjun Weekly and Tenkan Daily, a closure between these levels can help to find the point C we’re looking for. Maximum caution is needed with the confirmation of Daily, Weekly closure and confirmation.
It is important to evaluate the closing of the week on the following price structures:
Bullish 52500
Bearish 46600
It will be interesting to consider as a new point C the low of December 4th in the potential rebound using as A the low of September 21st and as B the all-time-high of December 10th.
For altcoins we can consider:
- Total Crypto Market Cap: started to increase
- Dominance of BTC: increasing
- Dominance of stable coin: decreasing a lot
- Dominance of altcoins increasing and ETH: decreasing
So, there are good opportunities to accumulate stronger Alt and take some BTC waiting for the pullback, even if as anticipated in the past week a dump happened, after the confirmation of this status for the weekly close.
Thanks for your attention, happy to support the TradingView community.
The Crypto Frog uses its Ichimoku Analysis Process with its toolset by looking at a glance at the BINANCE:BTCUSDT Daily chart using the “Crypto Market Settings” for the indicator as 10-30-60-30:
Macro Trend Analysis using Kumo:
- Tendency: Bitcoin is right now in Downtrend as confirmed by the Kumo Twist 9 days ago. The price is always on the support indicated by the Kijun Weekly and the Tenkan Daily that it just broke through. The rest of the medium/long term indicator signals indicate a Downtrend with a sideways bias.
- Price: The price is under the red Kumo and Chikou is under the price.
Supports and Resistances in the area:
- 75000.00 by Fibonacci
- 67000.00 by Historical Maximum (too much precise)
- 66001.41 by All-time-high Chikou
- 58000.00 strong price structure by flat lines
- 53800.00-54000 strong price structure by flat lines
- 48900 Kijun Weekly
For the various static price structures it is possible to refer to the chart where the structures identified by the flat moments of Tenkan, Kijun, Senkou Span A and Senkou Span B on different timeframes are plotted, also Chikou price for the Current timeframe.
Moreover, let us remember that the various lines of the Ichimoku serve as price structures: the Tenkan Sen (short term), the Kijun Sen (medium term) as well as the Senkou Span A and Senkou Span B (long term).
Heikin-Ashi:
The Heikih-Ashi confirms shows a potential uptrend with the first green candle with no shadow above.
Fibonacci
CryptoFall, which identifies Fibonacci levels, still shows us a positive sentiment and places the 0 upwards on 75000.
The price is testing the 0.5 level, after the bounce on 0.618.
Conclusions
The price is now showing a potential recovery as it is surpassing the Kinjun Weekly and Tenkan Daily, a closure between these levels can help to find the point C we’re looking for. Maximum caution is needed with the confirmation of Daily, Weekly closure and confirmation.
It is important to evaluate the closing of the week on the following price structures:
Bullish 52500
Bearish 46600
It will be interesting to consider as a new point C the low of December 4th in the potential rebound using as A the low of September 21st and as B the all-time-high of December 10th.
For altcoins we can consider:
- Total Crypto Market Cap: started to increase
- Dominance of BTC: increasing
- Dominance of stable coin: decreasing a lot
- Dominance of altcoins increasing and ETH: decreasing
So, there are good opportunities to accumulate stronger Alt and take some BTC waiting for the pullback, even if as anticipated in the past week a dump happened, after the confirmation of this status for the weekly close.
Thanks for your attention, happy to support the TradingView community.
- Scalping The Bull Indicator: linktr.ee/scalpingthebull
- Scalping The Bull Training: tinyurl.com/corsoindicatorepro
- AlgoTrading Training: tiny.one/corsopinescriptbase
- Crypto News: t.me/joinchat/StkXJM
- Scalping The Bull Training: tinyurl.com/corsoindicatorepro
- AlgoTrading Training: tiny.one/corsopinescriptbase
- Crypto News: t.me/joinchat/StkXJM
Penerbitan berkaitan
Penafian
Maklumat dan penerbitan adalah tidak dimaksudkan untuk menjadi, dan tidak membentuk, nasihat untuk kewangan, pelaburan, perdagangan dan jenis-jenis lain atau cadangan yang dibekalkan atau disahkan oleh TradingView. Baca dengan lebih lanjut di Terma Penggunaan.