📊 Market Anomaly Detector (MAD) – Performance Walkthrough
🔑 Core Concept
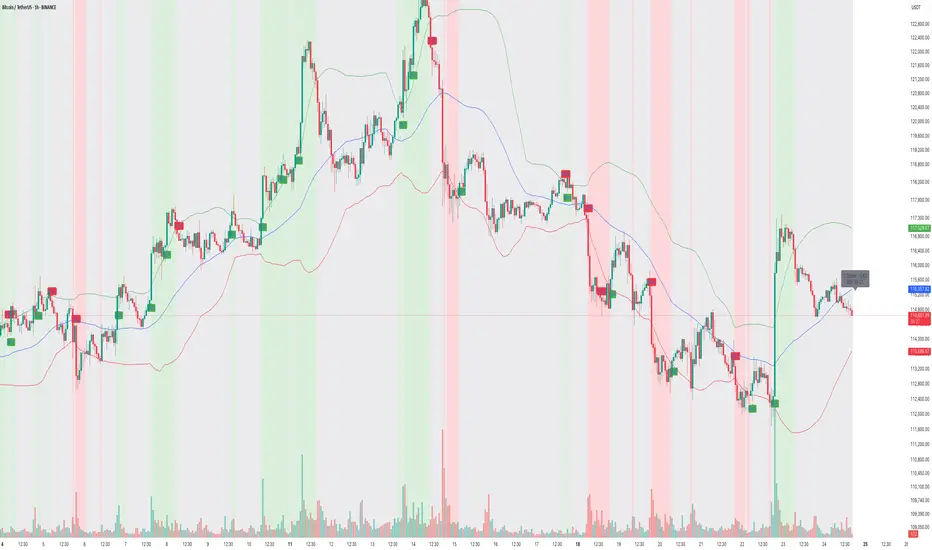
The Market Anomaly Detector (MAD) is designed to spot both trend continuations and reversals using volatility-adaptive bands and a statistical anomaly filter.
• Trend Signals:
• ✅ Buy → when price closes above the upper (green) band.
• ✅ Sell → when price closes below the lower (red) band.
• Reversal Signals:
• 🔄 Sell → when price falls back below the upper (green) band after a breakout.
• 🔄 Buy → when price climbs back above the lower (red) band after a breakdown.
This dual-layer logic helps the indicator capture clean trending moves while also spotting failed breakouts/breakdowns.
⸻
📉 Z-Score Logic – Detecting Market Craze
The Z-Score filter measures how far price activity deviates from its normal behavior:
• 📈 Z > +1 → Market shows bullish strength / craze.
• 📉 Z < –1 → Market shows bearish strength / craze.
• ⚖️ Between –1 and +1 → Market is in neutral / low-momentum mode.
🔎 Current Snapshot (Weekend Session):
• Z-Score = –0.52 → clearly reflects very low momentum.
• Volume is also weak, as is typical during weekends.
• Despite low activity, MAD still adapts and keeps traders aligned with the actual statistical condition of the market.
⸻
🟢 Bullish Examples
• Captured breakout above 118K → 123K with clear momentum.
• Z-Score crossed +1 confirming bullish craze.
🔴 Bearish Examples
• Detected reversal near 121K → 116K with breakdown signals.
• Z-Score dipped below –1, validating the downside momentum.
⸻
🛠 How to Use
1. Look at band breakouts/breakdowns for trade triggers.
2. Watch Z-Score:
• Above +1 → only take bullish signals.
• Below –1 → only take bearish signals.
• Between –1 & +1 → reduce exposure / trade smaller size.
3. Works best on 15m / 1h / 4h with additional filters (VWAP, volume, S/R).
⸻
🎯 Summary
The Market Anomaly Detector (MAD) combines price bands with Z-Score statistics to give traders a 360° view of both market direction and market strength.
• 📊 Captures trends.
• 🔄 Detects reversals.
• ⚖️ Adapts to low-momentum phases (like weekends).
This balance makes MAD a versatile tool for traders who want to stay ahead of both momentum moves and false breakouts.
🔑 Core Concept
The Market Anomaly Detector (MAD) is designed to spot both trend continuations and reversals using volatility-adaptive bands and a statistical anomaly filter.
• Trend Signals:
• ✅ Buy → when price closes above the upper (green) band.
• ✅ Sell → when price closes below the lower (red) band.
• Reversal Signals:
• 🔄 Sell → when price falls back below the upper (green) band after a breakout.
• 🔄 Buy → when price climbs back above the lower (red) band after a breakdown.
This dual-layer logic helps the indicator capture clean trending moves while also spotting failed breakouts/breakdowns.
⸻
📉 Z-Score Logic – Detecting Market Craze
The Z-Score filter measures how far price activity deviates from its normal behavior:
• 📈 Z > +1 → Market shows bullish strength / craze.
• 📉 Z < –1 → Market shows bearish strength / craze.
• ⚖️ Between –1 and +1 → Market is in neutral / low-momentum mode.
🔎 Current Snapshot (Weekend Session):
• Z-Score = –0.52 → clearly reflects very low momentum.
• Volume is also weak, as is typical during weekends.
• Despite low activity, MAD still adapts and keeps traders aligned with the actual statistical condition of the market.
⸻
🟢 Bullish Examples
• Captured breakout above 118K → 123K with clear momentum.
• Z-Score crossed +1 confirming bullish craze.
🔴 Bearish Examples
• Detected reversal near 121K → 116K with breakdown signals.
• Z-Score dipped below –1, validating the downside momentum.
⸻
🛠 How to Use
1. Look at band breakouts/breakdowns for trade triggers.
2. Watch Z-Score:
• Above +1 → only take bullish signals.
• Below –1 → only take bearish signals.
• Between –1 & +1 → reduce exposure / trade smaller size.
3. Works best on 15m / 1h / 4h with additional filters (VWAP, volume, S/R).
⸻
🎯 Summary
The Market Anomaly Detector (MAD) combines price bands with Z-Score statistics to give traders a 360° view of both market direction and market strength.
• 📊 Captures trends.
• 🔄 Detects reversals.
• ⚖️ Adapts to low-momentum phases (like weekends).
This balance makes MAD a versatile tool for traders who want to stay ahead of both momentum moves and false breakouts.
Thanks.
TradeTech Analysis
Telegram Channel - t.me/Tradetech2024
Youtube Channel - youtube.com/@TradeTechAnalysis
Website - tradetechanalysis.com/
Super Profile - superprofile.bio/tradetechanalysis
TradeTech Analysis
Telegram Channel - t.me/Tradetech2024
Youtube Channel - youtube.com/@TradeTechAnalysis
Website - tradetechanalysis.com/
Super Profile - superprofile.bio/tradetechanalysis
Penafian
Maklumat dan penerbitan adalah tidak dimaksudkan untuk menjadi, dan tidak membentuk, nasihat untuk kewangan, pelaburan, perdagangan dan jenis-jenis lain atau cadangan yang dibekalkan atau disahkan oleh TradingView. Baca dengan lebih lanjut di Terma Penggunaan.