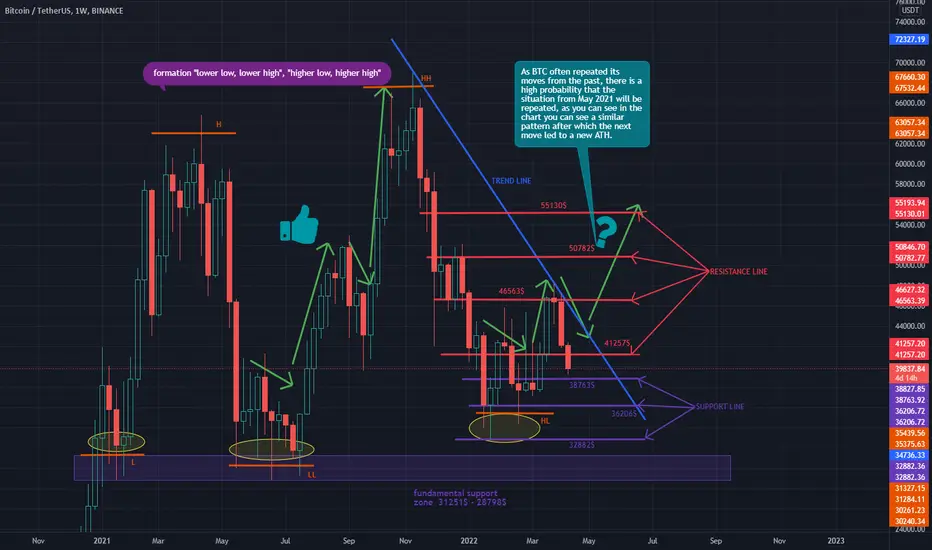
Hello everyone, let's take a look at the BTC to USDT chart. For 1 weekend interval. As you can see, the price is moving below the downtrend line.
However, it is worth noting that we can just see a higher peak and a higher low on the chart, as well as a very similar situation to that in May 2021.
Let's start with the designation of the support line and as you can see the first support in the near future is $ 38,763, if the support breaks, the next is $ 36,206 and $ 32,882 then we have the fundamental support zone from $ 31,251 to $ 28,798.
Now let's move from the resistance line, as you can see, the first resistance is $ 41,257, if you can break it, the next resistance will be $ 46,563 and $ 50,782, and another resistance is $ 55,130 = 0.618Fib.
Penafian
Maklumat dan penerbitan adalah tidak bertujuan, dan tidak membentuk, nasihat atau cadangan kewangan, pelaburan, dagangan atau jenis lain yang diberikan atau disahkan oleh TradingView. Baca lebih dalam Terma Penggunaan.
Penafian
Maklumat dan penerbitan adalah tidak bertujuan, dan tidak membentuk, nasihat atau cadangan kewangan, pelaburan, dagangan atau jenis lain yang diberikan atau disahkan oleh TradingView. Baca lebih dalam Terma Penggunaan.