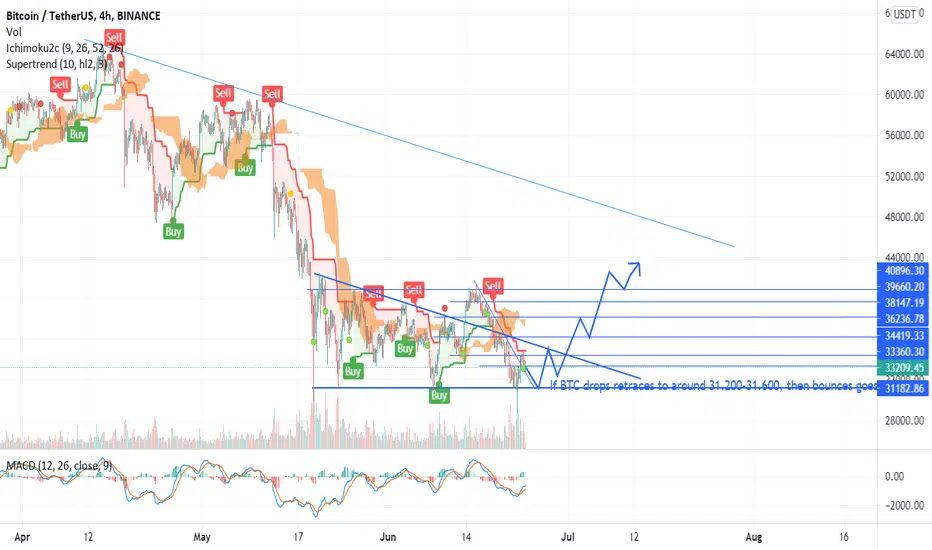
As a lot of people are talking about the possible Wyckoff accumulation, I've tried to map out how it could look on the charts.
We would currently be in phase C, where we just had the spring and now need the retest with a higher low then the spring.
After that we'll enter phase D where we would see an increase in Volume and a breakout above the resistance level of the 40k-42k level.
Not saying this will play out but I'm keeping an eye on this for a possible long trade.
I would like to see some bullish indicators on the 4h chart first. For the moment it still looks bearisch on the higher timeframes.
Penafian
Maklumat dan penerbitan adalah tidak dimaksudkan untuk menjadi, dan tidak membentuk, nasihat untuk kewangan, pelaburan, perdagangan dan jenis-jenis lain atau cadangan yang dibekalkan atau disahkan oleh TradingView. Baca dengan lebih lanjut di Terma Penggunaan.
Penafian
Maklumat dan penerbitan adalah tidak dimaksudkan untuk menjadi, dan tidak membentuk, nasihat untuk kewangan, pelaburan, perdagangan dan jenis-jenis lain atau cadangan yang dibekalkan atau disahkan oleh TradingView. Baca dengan lebih lanjut di Terma Penggunaan.