👋🏻 Hey everyone! Hope you’re doing great! Welcome to SatoshiFrame channel.
✨ Today we’re diving into the 4-Hour Bitcoin analysis. Stay tuned and follow along!
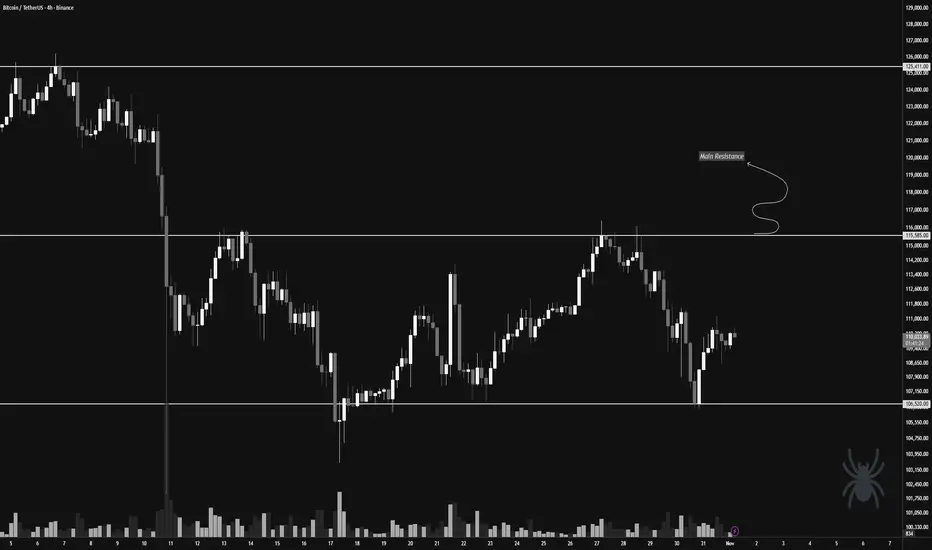
👀 On the 4-hour timeframe, we can see that Bitcoin recently dropped due to the impact of the FOMC news but then rebounded from the key support level at $106,520 and is now facing its multi-timeframe resistances. Looking at the chart more broadly, we notice equal highs and lows around the $115,585 and $106,520 zones. With a breakout of either of these levels, Bitcoin could experience a sharp and significant move.
🧲 Bitcoin’s selling volume has slightly increased, and if the supports break, this selling could turn into pressure — collectively applying downward force on the market price. Then, buyers may re-enter and start buying Bitcoin again. The hypothesis of a possible distribution phase could turn into a valid theory; however, we must be cautious — if Bitcoin decides to move upward after Monday’s session, it could confirm a new all-time high and continue its upward trend.
✍️ The main scenario for Bitcoin lies around the $115,585 price zone. If this level breaks, we could enter a long position and stay with it for a potentially extended upward move. It’s worth noting that an increase in buying volume along this path could serve as a strong confirmation for our long position.
On the other hand, the short position scenario would become valid if the price breaks below the support and selling pressure intensifies, giving us a high-momentum short setup.
❤️ Disclaimer : This analysis is purely based on my personal opinion and I only trade if the stated triggers are activated .
✨ Today we’re diving into the 4-Hour Bitcoin analysis. Stay tuned and follow along!
👀 On the 4-hour timeframe, we can see that Bitcoin recently dropped due to the impact of the FOMC news but then rebounded from the key support level at $106,520 and is now facing its multi-timeframe resistances. Looking at the chart more broadly, we notice equal highs and lows around the $115,585 and $106,520 zones. With a breakout of either of these levels, Bitcoin could experience a sharp and significant move.
🧲 Bitcoin’s selling volume has slightly increased, and if the supports break, this selling could turn into pressure — collectively applying downward force on the market price. Then, buyers may re-enter and start buying Bitcoin again. The hypothesis of a possible distribution phase could turn into a valid theory; however, we must be cautious — if Bitcoin decides to move upward after Monday’s session, it could confirm a new all-time high and continue its upward trend.
✍️ The main scenario for Bitcoin lies around the $115,585 price zone. If this level breaks, we could enter a long position and stay with it for a potentially extended upward move. It’s worth noting that an increase in buying volume along this path could serve as a strong confirmation for our long position.
On the other hand, the short position scenario would become valid if the price breaks below the support and selling pressure intensifies, giving us a high-momentum short setup.
❤️ Disclaimer : This analysis is purely based on my personal opinion and I only trade if the stated triggers are activated .
Penerbitan berkaitan
Penafian
Maklumat dan penerbitan adalah tidak bertujuan, dan tidak membentuk, nasihat atau cadangan kewangan, pelaburan, dagangan atau jenis lain yang diberikan atau disahkan oleh TradingView. Baca lebih dalam Terma Penggunaan.
Penerbitan berkaitan
Penafian
Maklumat dan penerbitan adalah tidak bertujuan, dan tidak membentuk, nasihat atau cadangan kewangan, pelaburan, dagangan atau jenis lain yang diberikan atau disahkan oleh TradingView. Baca lebih dalam Terma Penggunaan.