The 
 BTCUSDT price was trading near $110,100 after gaining more than 2% in the past 24 hours. This erased the week’s losses and left the seven-day chart flat. Over the past three months, gains stayed capped below 5%, but year-on-year, the BTCUSDT price still shows strength with an 80% rise.
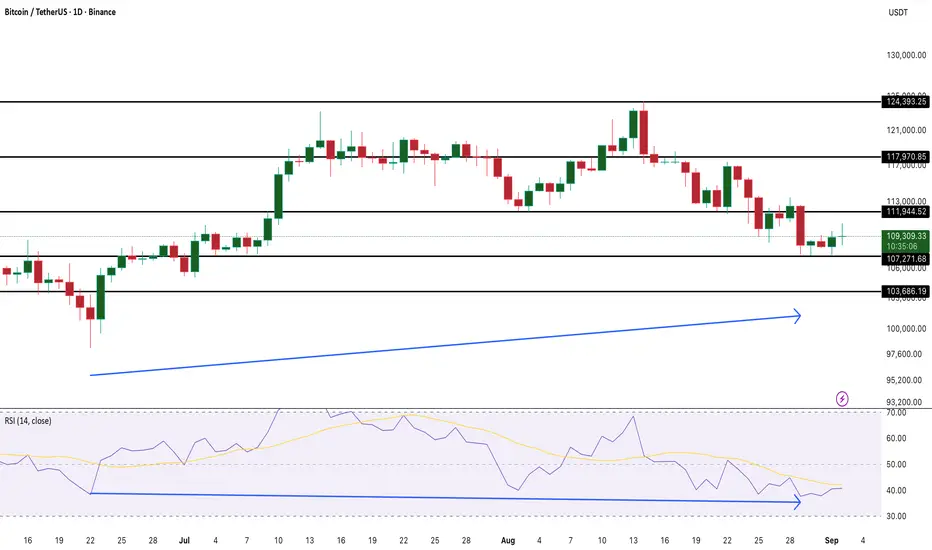
On the daily chart,BTCUSDT has formed a higher low while the Relative Strength Index (RSI), which tracks momentum, has made a lower low. This hidden bullish divergence often points to continuation of the trend. If buyers defend $107,200 and break resistance near $111,900, the BTCUSDT could move toward $117,900. A close below $107,200, however, would flip the picture bearish.
Derivatives data suggests optimism but with limited downside. The Taker Buy/Sell ratio has climbed to 1.10, showing more aggressive buying in futures markets. A cost-basis heatmap highlights strong resistance between $109,995 and $111,768, while support sits between $108,250 and $108,829. Unless heavy selling returns, this floor limits the risk of a deeper pullback.
Whale flows also ease pressure. The exchange-to-whale ratio dropped from 0.54 to 0.44 since August 29, meaning large holders are not sending coins to exchanges to sell. Prices moved from $108,332 to above $110,100 during that time, confirming whales are not offloading into strength.
On the daily chart,
Derivatives data suggests optimism but with limited downside. The Taker Buy/Sell ratio has climbed to 1.10, showing more aggressive buying in futures markets. A cost-basis heatmap highlights strong resistance between $109,995 and $111,768, while support sits between $108,250 and $108,829. Unless heavy selling returns, this floor limits the risk of a deeper pullback.
Whale flows also ease pressure. The exchange-to-whale ratio dropped from 0.54 to 0.44 since August 29, meaning large holders are not sending coins to exchanges to sell. Prices moved from $108,332 to above $110,100 during that time, confirming whales are not offloading into strength.
Leader in crypto news, award winning journalism in 26 languages.
Penafian
The information and publications are not meant to be, and do not constitute, financial, investment, trading, or other types of advice or recommendations supplied or endorsed by TradingView. Read more in the Terms of Use.
Leader in crypto news, award winning journalism in 26 languages.
Penafian
The information and publications are not meant to be, and do not constitute, financial, investment, trading, or other types of advice or recommendations supplied or endorsed by TradingView. Read more in the Terms of Use.