☃️ Welcome to the cryptos winter , I hope you’ve started your day well.
⏰ We’re analyzing BTC on the 1-Hour timeframe .
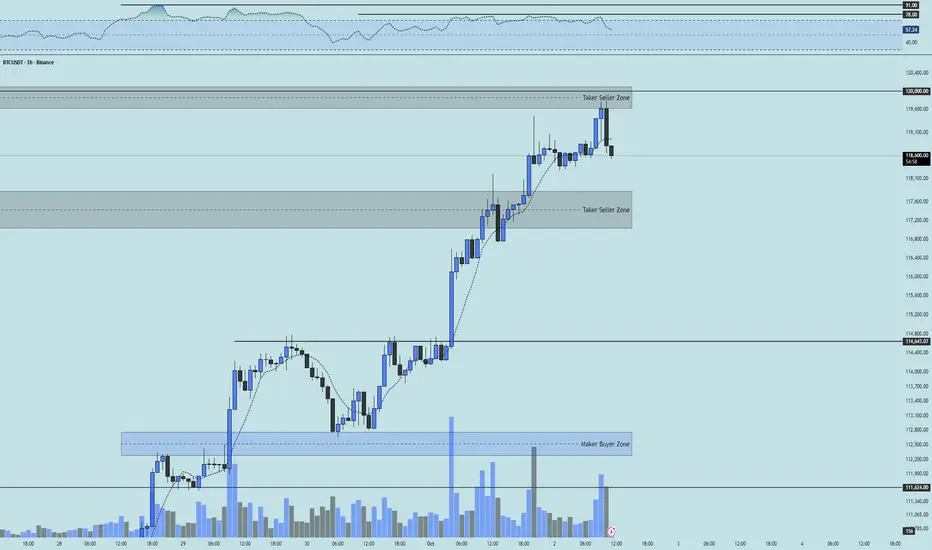
👀 On the 1H timeframe for Bitcoin, after breaking through the taker-seller zone around $117,550, price pushed up toward its resistance area near $120,000. From there, we’ve started to see early signs of rejection. With a 1H candle close rejecting this zone, we can say that after such a strong rally, Bitcoin is now entering its corrective phase, moving back toward its key support levels. Let’s break it down deeper.
🧮 The RSI oscillator, after consolidating for about 1 day and 6 hours around the overbuy boundary, has now started to exit that zone. This suggests potential downside momentum toward its key swing supports. Keep in mind, a static swing resistance formed at the 78 level in overbuy territory. If that breaks — along with the taker-seller zone — long trades could push RSI up toward 91 before facing a possible rejection (a less likely scenario for now). At this stage, I don’t have a clear key support zone to highlight, but with corrective structure forming, I’ll point out the levels to watch in future updates.
🕯 Today’s buying candles expanded slightly in size and volume following the weaker USD news. However, because the move up has been sharp and the number of selling candles limited, hitting the taker-seller zone increases the probability of a pullback. A strong close with solid selling volume would confirm corrective pressure for Bitcoin.
🧠 I believe the smarter approach is to wait for the corrective structure to play out first. Once the new resistance levels are defined and broken, we can look for setups. Keep in mind, shorting here isn’t ideal — the broader trend is still strongly bullish and momentum is very powerful. The goal is to position for the next high-probability move, not fight the trend.
↗️ Long scenario: A Bitcoin long could be considered on a clean break above RSI 78 combined with a strong candle close above the marked taker-seller zone, ideally supported by increasing buy volume. Multi-timeframe candle setups would give stronger confirmation for entry.
📉 Short scenario: At the moment, I don’t see a high-probability short setup. Long positions are simply carrying more edge (and dopamine).
❤️ Disclaimer : This analysis is purely based on my personal opinion and I only trade if the stated triggers are activated .
❄️ Join the Action Now ❄️
Telegram
t.me/CryptosWinter
Mexc
promote.mexc.com/r/HHAkF63P
Bitunix
bitunix.com/register?inviteCode=28r21f
Telegram
t.me/CryptosWinter
Mexc
promote.mexc.com/r/HHAkF63P
Bitunix
bitunix.com/register?inviteCode=28r21f
Penerbitan berkaitan
Penafian
Maklumat dan penerbitan adalah tidak dimaksudkan untuk menjadi, dan tidak membentuk, nasihat untuk kewangan, pelaburan, perdagangan dan jenis-jenis lain atau cadangan yang dibekalkan atau disahkan oleh TradingView. Baca dengan lebih lanjut di Terma Penggunaan.
