BTC/USDT: Symmetrical Triangle Signals Potential Downside Move
Hi!
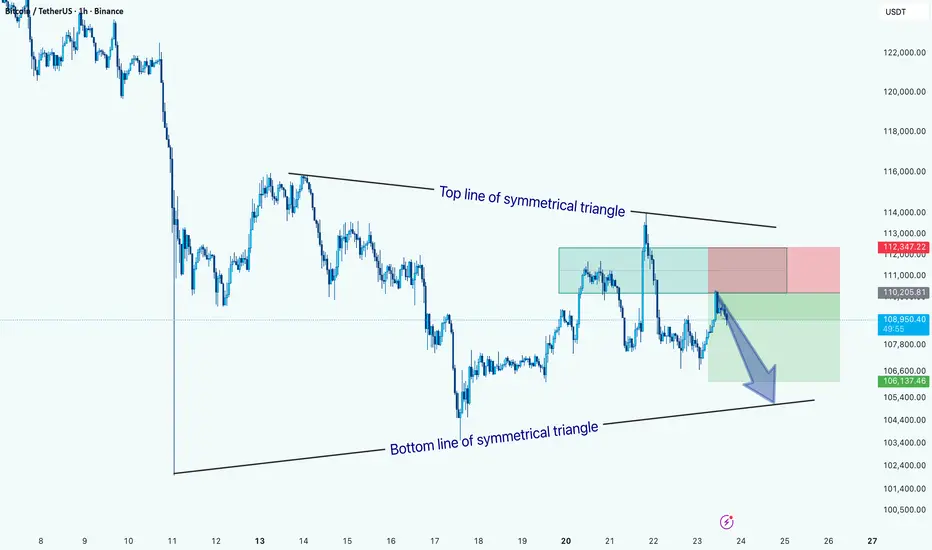
The price action is currently forming a symmetrical triangle pattern, marked by converging trendlines, the top line showing lower highs and the bottom line showing higher lows.
At present, BTC is trading near the upper half of the pattern but has recently faced rejection from the top trendline, indicating potential bearish pressure. The highlighted setup suggests a short position targeting a move toward the bottom boundary of the triangle around $106,000–$105,500, with a stop loss near $112,300.
A confirmed break below the lower trendline could accelerate bearish momentum, while a breakout above the top line would invalidate this bearish scenario and signal possible trend reversal.
Bias: Bearish within the symmetrical triangle until a clear breakout occurs.
Key Levels:
- Resistance: $112,300
- Support: $106,000 / $105,500
Dagangan aktif
Proud ThinkMarkets Ambassador -> Discover & Grow: bit.ly/Think-Markets
------
My recommended Exchange -> YEX: bit.ly/YEX-M
------
Telegram channel: t.me/melikatrader94
Forex channel: t.me/melikatrader94GoldForex
------
My recommended Exchange -> YEX: bit.ly/YEX-M
------
Telegram channel: t.me/melikatrader94
Forex channel: t.me/melikatrader94GoldForex
Penerbitan berkaitan
Penafian
Maklumat dan penerbitan adalah tidak dimaksudkan untuk menjadi, dan tidak membentuk, nasihat untuk kewangan, pelaburan, perdagangan dan jenis-jenis lain atau cadangan yang dibekalkan atau disahkan oleh TradingView. Baca dengan lebih lanjut di Terma Penggunaan.