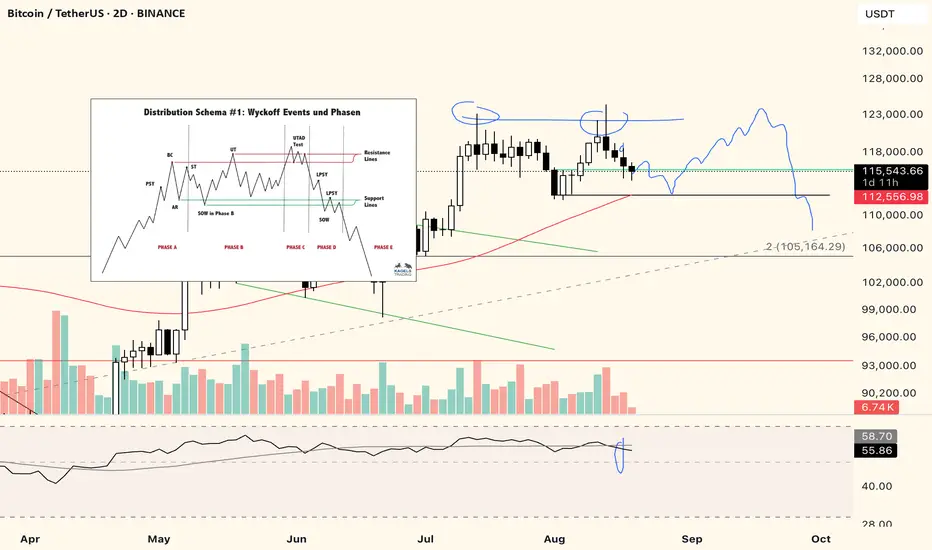
As said in the title, looking for a distribution pattern to play out in Bitcoin. Please keep in mind that this is playing out on a relative lower timeframe. So one might see this as in-between sorcery while HTF trend continues to be up.
If it plays out like this, it means BTC will remain in a horizontal consolidation area allowing $MARKETSCOM:ETHEREUM and TOTAL3 to continue to perform. Which in turn means we might see more bullish PA on ETH and ALTS over the next 1-2 months. When BTC indeed reaches a UTAD phase, there should follow a market-wide drop for cryptocurrencies.
This market-wide drop might be a steep one, dragging alts down -50% or such. But, if the HTF trend continues to be up, this might become a drop that is worth buying and leading towards a blow-off top phase towards 2026?
If it plays out like this, it means BTC will remain in a horizontal consolidation area allowing $MARKETSCOM:ETHEREUM and
This market-wide drop might be a steep one, dragging alts down -50% or such. But, if the HTF trend continues to be up, this might become a drop that is worth buying and leading towards a blow-off top phase towards 2026?
Nota
Slightly weaker version played out, without a UTAD. See new schematic on the chart.Ideally we see 105K hit before possible uptrend can contine.
Penafian
Maklumat dan penerbitan adalah tidak bertujuan, dan tidak membentuk, nasihat atau cadangan kewangan, pelaburan, dagangan atau jenis lain yang diberikan atau disahkan oleh TradingView. Baca lebih dalam Terma Penggunaan.
Penafian
Maklumat dan penerbitan adalah tidak bertujuan, dan tidak membentuk, nasihat atau cadangan kewangan, pelaburan, dagangan atau jenis lain yang diberikan atau disahkan oleh TradingView. Baca lebih dalam Terma Penggunaan.