hi friends ..
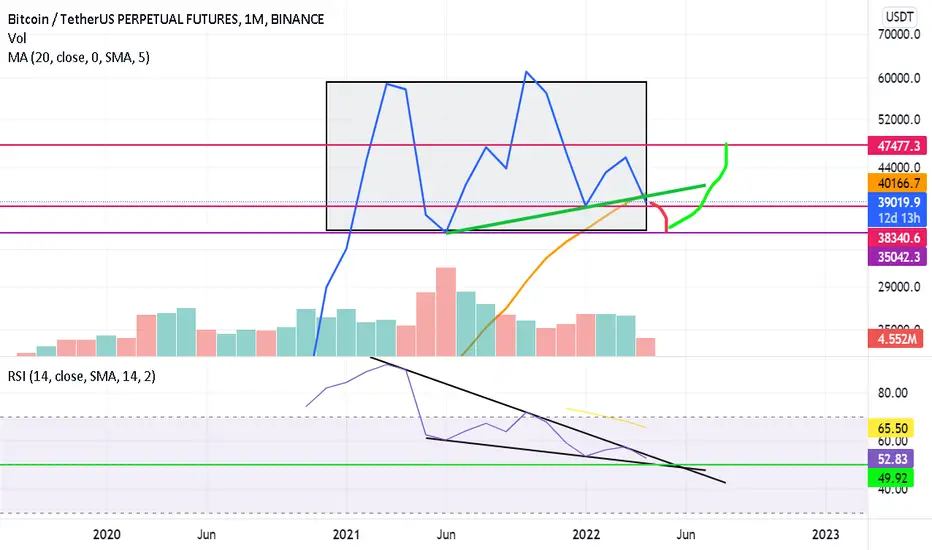
first look at the chart .. i prefer the line chart for monthly time frame
we have 2 important poin in this chart :
first :
The price is breaking the green uptrend line.
On the other hand, price is breaking down moving average 20 days (MA 20).
Since this is a monthly time frame, all of these breaks may appear as shadows
You can also see in the RSI indicator that the price has not yet broken the downward trend.
I think the price will go down to 35k.
Penafian
Maklumat dan penerbitan adalah tidak dimaksudkan untuk menjadi, dan tidak membentuk, nasihat untuk kewangan, pelaburan, perdagangan dan jenis-jenis lain atau cadangan yang dibekalkan atau disahkan oleh TradingView. Baca dengan lebih lanjut di Terma Penggunaan.
Penafian
Maklumat dan penerbitan adalah tidak dimaksudkan untuk menjadi, dan tidak membentuk, nasihat untuk kewangan, pelaburan, perdagangan dan jenis-jenis lain atau cadangan yang dibekalkan atau disahkan oleh TradingView. Baca dengan lebih lanjut di Terma Penggunaan.