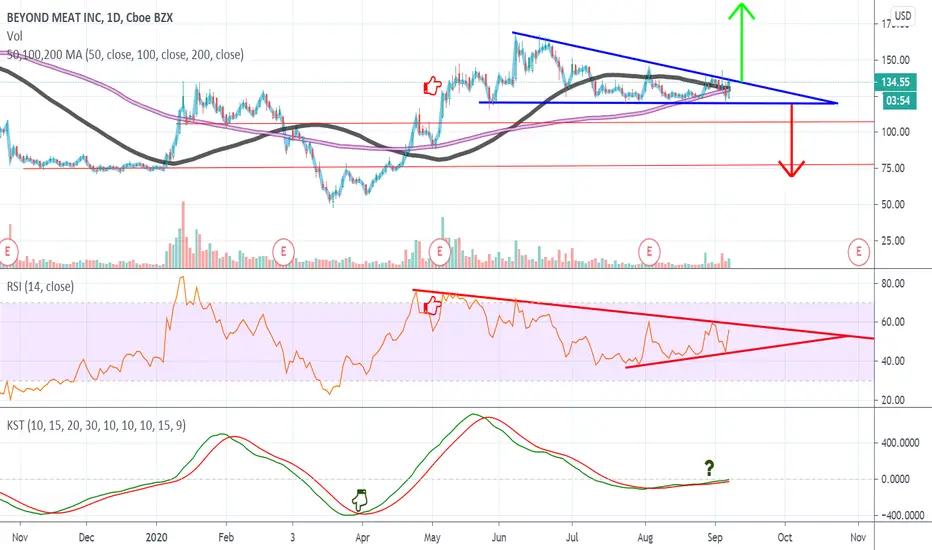
On the RSI there was a noticeable bearish divergence that started in May where I have the red finger pointing sideways, meaning, the price was increasing but the RSI was decreasing, it appears as though the divergence has completed.
On the KST there's potentially a bullish cross happening, I have placed a green finger icon to represent a previous bullish cross, and a question mark to represent where there's one potentially happening now.
On the KST there's potentially a bullish cross happening, I have placed a green finger icon to represent a previous bullish cross, and a question mark to represent where there's one potentially happening now.
Penafian
Maklumat dan penerbitan adalah tidak dimaksudkan untuk menjadi, dan tidak membentuk, nasihat untuk kewangan, pelaburan, perdagangan dan jenis-jenis lain atau cadangan yang dibekalkan atau disahkan oleh TradingView. Baca dengan lebih lanjut di Terma Penggunaan.
Penafian
Maklumat dan penerbitan adalah tidak dimaksudkan untuk menjadi, dan tidak membentuk, nasihat untuk kewangan, pelaburan, perdagangan dan jenis-jenis lain atau cadangan yang dibekalkan atau disahkan oleh TradingView. Baca dengan lebih lanjut di Terma Penggunaan.