Full Analysis
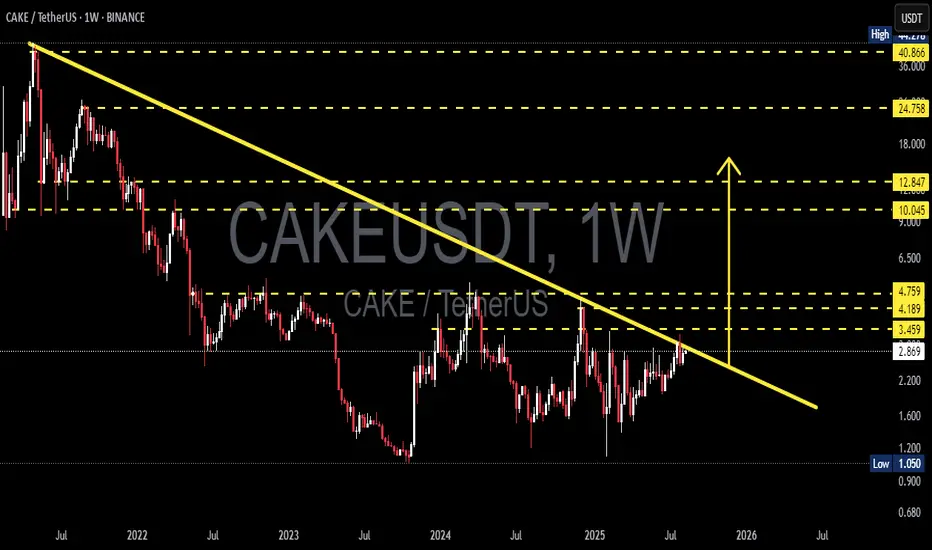
CAKE/USDT is now at one of the most critical points since the 2021 bear market began. Price is currently around $2.87, touching the multi-year downtrend line that has acted as a ceiling for more than three years.
From the chart, we can see:
📉 Downtrend Line: Originating from the 2021 all-time high, connecting multiple lower highs. It’s a major resistance that has never been broken since the decline started.
📊 Layered Resistance Zones: $3.46 → $4.19 → $4.76, followed by major resistances at $10.04 and $12.85.
📈 Strong Support Zones: $2.20 (minor support), $1.60, and the historical low at $1.05.
⏳ Consolidation Range: Since 2023, price has mostly moved sideways — potentially signaling quiet accumulation before a major move.
---
Pattern & Context
The current market structure shows:
1. Compression / Pressure Convergence: Downtrend line meets strong horizontal support → often a trigger for either a breakout or a sharp rejection.
2. Potential Breakout Setup: A weekly close above the trendline + key level $3.45–$3.50 could mark the start of a bullish reversal.
3. Bearish Continuation Risk: Failure to break out and a rejection from this zone could resume the long-term downtrend channel toward previous lows.
---
Bullish Scenario 🟢
Trigger: Weekly close above $3.50 + strong breakout volume.
Target 1: $4.19 → psychological and horizontal resistance.
Target 2: $4.76 → a historical supply zone.
Mid-term Target: $10.04 → a key historical resistance; breaking it could open the way to $12.85 and even $24.76 (in case of a strong market-wide bullish cycle).
Extra Confirmation: RSI > 55–60, MACD bullish cross on the weekly timeframe.
---
Bearish Scenario 🔴
Trigger: Rejection at the trendline + weekly close below $2.70.
Target 1: $2.20 → intra-range support.
Target 2: $1.60 → previous major support from 2022–2023.
Final Target: $1.05 → historical low, possible liquidity grab in a panic sell.
Extra Confirmation: Long upper wicks, increasing selling volume, RSI failing to cross above 50.
---
Strategy & Risk Management
Breakout Traders: Wait for a confirmed weekly close above $3.50 before entering, with stops below the swing low or trendline.
Rejection Traders: Look for false breakout signals at the trendline to short with targets at lower supports.
Position Sizing: Risk only 1–3% per trade.
Multi-TF Confirmation: Check daily and 4H charts to validate breakout/rejection setups.
---
Conclusion
📍 CAKE is at a make-or-break point — will this be the start of a major trend reversal or a continuation of the long-standing downtrend? Medium- and long-term traders should closely watch the weekly close this week.
🚨 A breakout here could reshape the entire trend map — but beware of potential fakeouts that are common at such key moments.
---
> CAKE/USDT is testing a multi-year downtrend line after 3 years of pressure. A weekly close above $3.50 could open the path to $4.19–$4.76, and even $10+. A rejection here risks a drop to $2.20 or $1.05. This could be the start of a major trend change — or the biggest trap of the year.
#CAKEUSDT #PancakeSwap #CryptoAnalysis #PriceAction #Breakout #TechnicalAnalysis #CryptoTrading #WeeklyChart #SupportResistance #TrendReversal #CryptoBreakout #DeFi
✅ Get Free Signals! Join Our Telegram Channel Here: t.me/TheCryptoNuclear
✅ Twitter: twitter.com/crypto_nuclear
✅ Join Bybit : partner.bybit.com/b/nuclearvip
✅ Benefits : Lifetime Trading Fee Discount -50%
✅ Twitter: twitter.com/crypto_nuclear
✅ Join Bybit : partner.bybit.com/b/nuclearvip
✅ Benefits : Lifetime Trading Fee Discount -50%
Penafian
Maklumat dan penerbitan adalah tidak dimaksudkan untuk menjadi, dan tidak membentuk, nasihat untuk kewangan, pelaburan, perdagangan dan jenis-jenis lain atau cadangan yang dibekalkan atau disahkan oleh TradingView. Baca dengan lebih lanjut di Terma Penggunaan.