CAN Long: Bullish Reversal Setup with Upside Potential to 1.55
Canaan Inc. ( CAN), a key player in Bitcoin mining hardware, has endured a steep downtrend throughout 2025, sliding from peaks near 3.50 down to recent troughs around 0.80 amid crypto sector headwinds. However, the chart is flashing signs of exhaustion and a potential bullish reversal, with price stabilizing and momentum indicators turning positive.
Technical Analysis:
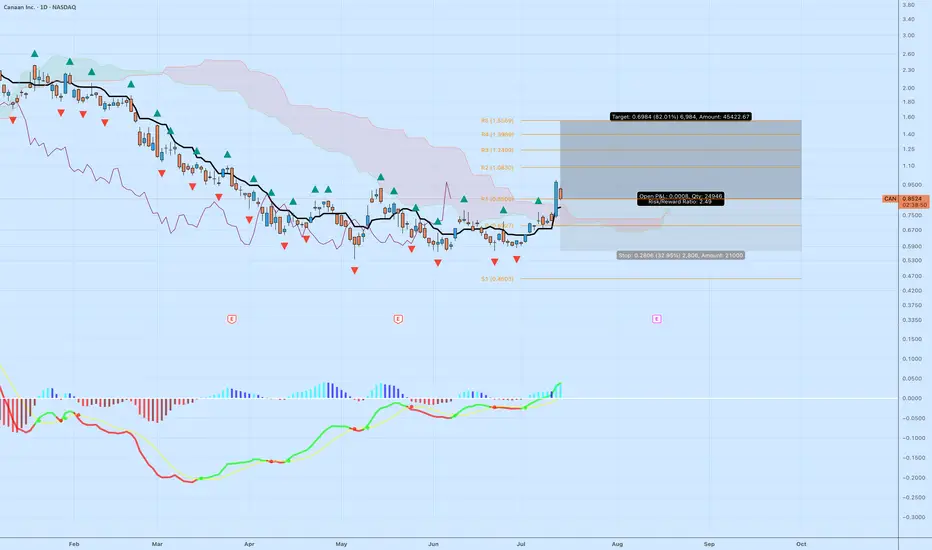
Price Action and Structure: After a series of lower highs and lows, the stock has bounced from support near 0.80, with the latest close at 0.8503 showing buyer interest. Price is pushing against a descending trendline (red down-arrows) and exiting a consolidation cloud (likely Ichimoku Kumo, shaded purple), which could transition from resistance to support on a sustained breakout.
Key Levels:
Support: Immediate floor at recent lows (~0.80), with deeper support at S1 (0.4603) if selling resumes.
Resistances: Layered overhead including R1 (1.0666), R2 (1.0830), R3 (1.2409), R4 (1.3969), and R5 (1.5669). Targeting the higher end near 1.55 aligns with extension toward R5 for a stronger move.
Indicators:
The lower panel oscillator (resembling MACD with red/green bars and lines in red, green, yellow) displays a bullish crossover: green line above red, histogram shifting from red (bearish) to blue/green (bullish). This suggests momentum divergence and potential for upside continuation.
Volume spikes on recent upticks reinforce buying pressure.
Trade Setup:
Entry: Enter long at current levels around 0.85, or wait for a close above cloud resistance (~0.90) for confirmation.
Target: Take profit at 1.55 (near R5 confluence), offering approximately 82% upside from entry based on chart projections and historical patterns.
Stop Loss: Place below key support at 0.57 to account for volatility, providing room for minor pullbacks while protecting capital.
Risk/Reward Ratio: About 2.5:1 (reward of 0.70 vs. risk of 0.28 per share), a solid setup for the potential reversal in this high-volatility stock. Size positions to risk 1-2% of total capital max.
Invalidation: Exit if price breaks decisively below 0.57, signaling downtrend resumption toward lower supports.
Technical Analysis:
Price Action and Structure: After a series of lower highs and lows, the stock has bounced from support near 0.80, with the latest close at 0.8503 showing buyer interest. Price is pushing against a descending trendline (red down-arrows) and exiting a consolidation cloud (likely Ichimoku Kumo, shaded purple), which could transition from resistance to support on a sustained breakout.
Key Levels:
Support: Immediate floor at recent lows (~0.80), with deeper support at S1 (0.4603) if selling resumes.
Resistances: Layered overhead including R1 (1.0666), R2 (1.0830), R3 (1.2409), R4 (1.3969), and R5 (1.5669). Targeting the higher end near 1.55 aligns with extension toward R5 for a stronger move.
Indicators:
The lower panel oscillator (resembling MACD with red/green bars and lines in red, green, yellow) displays a bullish crossover: green line above red, histogram shifting from red (bearish) to blue/green (bullish). This suggests momentum divergence and potential for upside continuation.
Volume spikes on recent upticks reinforce buying pressure.
Trade Setup:
Entry: Enter long at current levels around 0.85, or wait for a close above cloud resistance (~0.90) for confirmation.
Target: Take profit at 1.55 (near R5 confluence), offering approximately 82% upside from entry based on chart projections and historical patterns.
Stop Loss: Place below key support at 0.57 to account for volatility, providing room for minor pullbacks while protecting capital.
Risk/Reward Ratio: About 2.5:1 (reward of 0.70 vs. risk of 0.28 per share), a solid setup for the potential reversal in this high-volatility stock. Size positions to risk 1-2% of total capital max.
Invalidation: Exit if price breaks decisively below 0.57, signaling downtrend resumption toward lower supports.
Dagangan aktif
Dagangan ditutup secara manual
I am outIf you found my trades helpful, please consider sending a tip in BTC to: bc1qr35mrh82hykpy9v6znpsyuew85x84ezjyrrf6m
Penafian
Maklumat dan penerbitan adalah tidak dimaksudkan untuk menjadi, dan tidak membentuk, nasihat untuk kewangan, pelaburan, perdagangan dan jenis-jenis lain atau cadangan yang dibekalkan atau disahkan oleh TradingView. Baca dengan lebih lanjut di Terma Penggunaan.
If you found my trades helpful, please consider sending a tip in BTC to: bc1qr35mrh82hykpy9v6znpsyuew85x84ezjyrrf6m
Penafian
Maklumat dan penerbitan adalah tidak dimaksudkan untuk menjadi, dan tidak membentuk, nasihat untuk kewangan, pelaburan, perdagangan dan jenis-jenis lain atau cadangan yang dibekalkan atau disahkan oleh TradingView. Baca dengan lebih lanjut di Terma Penggunaan.